OPEN-SOURCE SCRIPT
[KY]New High New Low Ratio

(1) What is New High/New Low ratio?
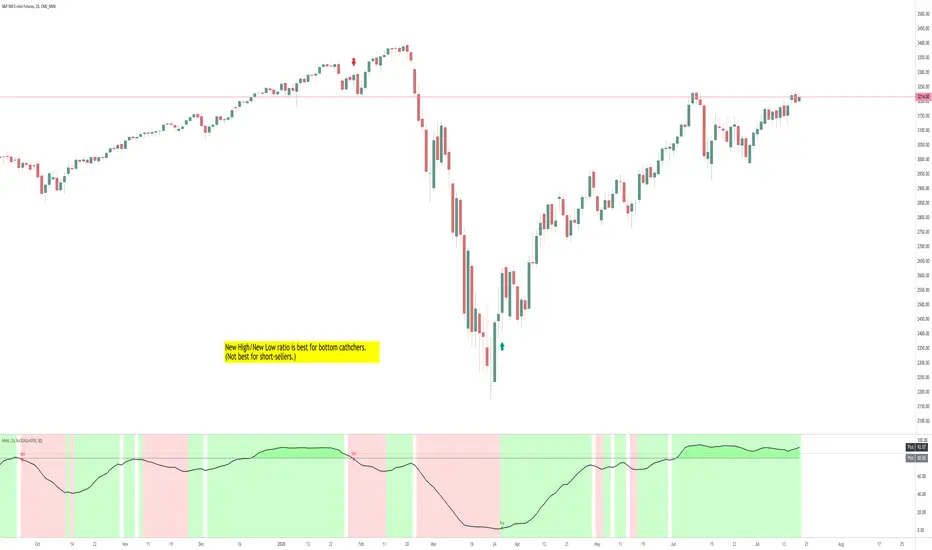
New High/New Low ratio is a ratio based on new 52-week high issues and new 52-week low issues.
This indicator is best for identifying a bottom if you use this with other breadth indicators.
However, this is not so useful to know the timing for short because bull momentum tends to continue.
(Market top period is long, market bottom period is short.)
Reference: Stochcharts.com
school.stockcharts.com/doku.php?id=market_indicators:high_low_index
(2) How to use?
- Add this indicator to your chart.
- Overbought >85 tends to continue, so don't short too early. You rather want to hold long until bull momentum deteriorates.
Dark green = bullish momentum zone.
- Oversold < 30 and if rolls over at the bottom, you can pile up long position.
Open-source script
In true TradingView spirit, the author of this script has published it open-source, so traders can understand and verify it. Cheers to the author! You may use it for free, but reuse of this code in publication is governed by House rules. You can favorite it to use it on a chart.
Disclaimer
The information and publications are not meant to be, and do not constitute, financial, investment, trading, or other types of advice or recommendations supplied or endorsed by TradingView. Read more in the Terms of Use.