OPEN-SOURCE SCRIPT
Volume Chart
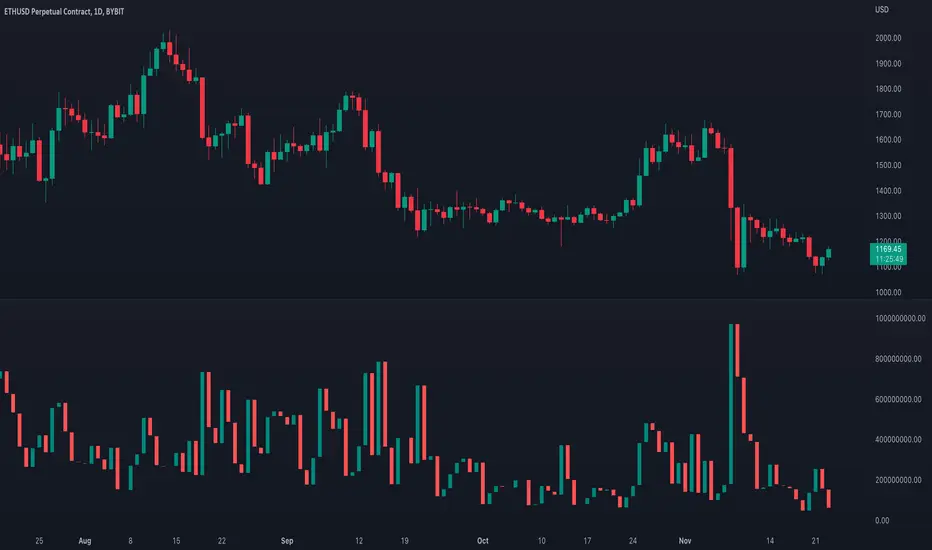
Volume data can be interpreted in many different ways. This is a very basic script and novel idea to display volume as a chart. The purpose of this script is to visually help identify volume breakouts and other common chart patterns. While this indicator could be useful for finding big moves and early reversals it not reliable for determining the direction of the move.
Below is an example of a volume breakout:

Below is confirmation of the second ear in the batman pattern:

Lower highs and higher lows can give early signs of a reversal:

Below we can see retailers getting pumped and dumped on during the gaps while they sleep:

Below is an example of a volume breakout:
Below is confirmation of the second ear in the batman pattern:
Lower highs and higher lows can give early signs of a reversal:
Below we can see retailers getting pumped and dumped on during the gaps while they sleep:
Open-source script
In true TradingView spirit, the author of this script has published it open-source, so traders can understand and verify it. Cheers to the author! You may use it for free, but reuse of this code in publication is governed by House rules. You can favorite it to use it on a chart.
Disclaimer
The information and publications are not meant to be, and do not constitute, financial, investment, trading, or other types of advice or recommendations supplied or endorsed by TradingView. Read more in the Terms of Use.