PROTECTED SOURCE SCRIPT
Adaptive Support and Resistance
Updated

This is part 11 of 11 in the system named Ninetales/Volt V2 you can find on Tradingview.
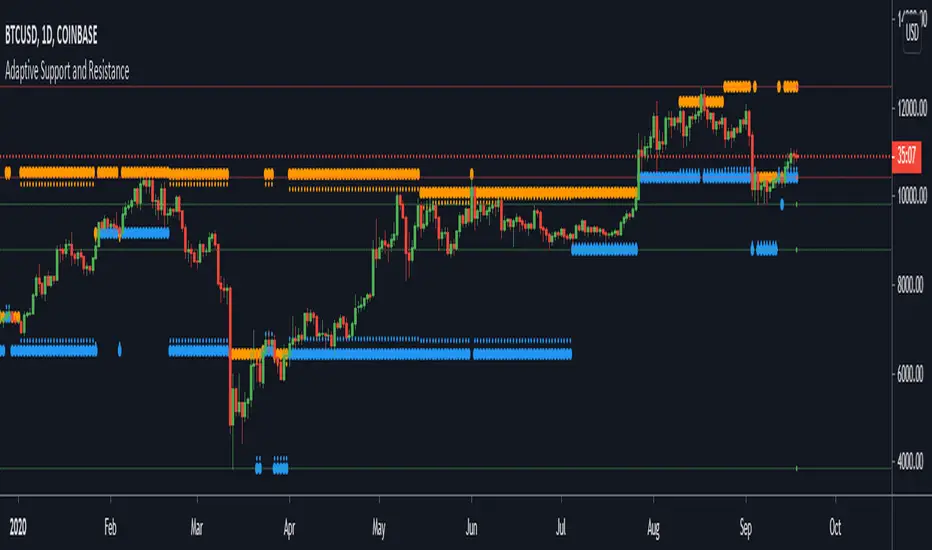
It will plot local support and resistance in red and green, then override them with blue when they are active as support, and orange when they are active as resistance.
It's just getting swing highs and plotting for the actual support/resists, the blue and orange come into play by measuring how much opportunity there is to purchase before exiting the zones withing the specified percent from the levels.
Release Notes
Updated logic better tracks results of value combinations.Disclaimer
The information and publications are not meant to be, and do not constitute, financial, investment, trading, or other types of advice or recommendations supplied or endorsed by TradingView. Read more in the Terms of Use.