PROTECTED SOURCE SCRIPT
Triple Quadratic Regression (w/ Normalized Value Table)
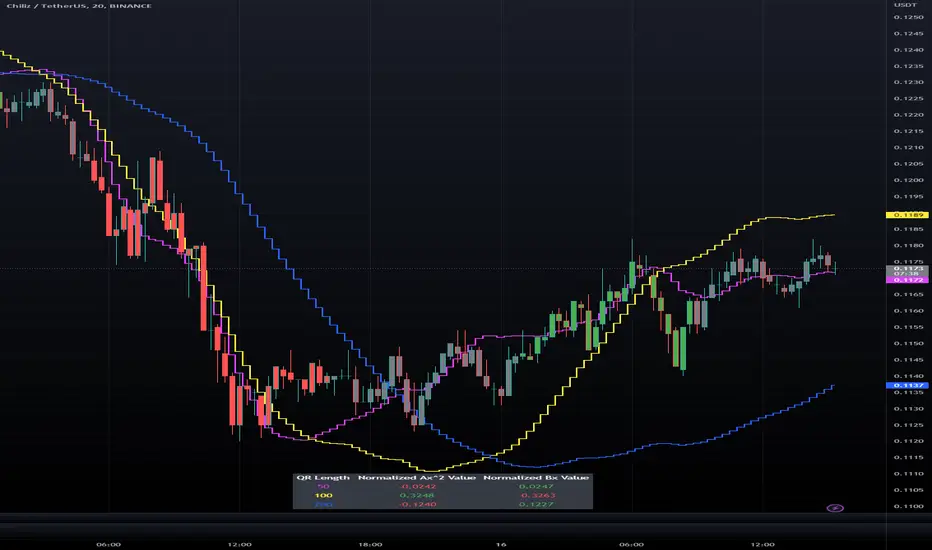
This indicator draws three step lines - a fast (fuchsia), a medium (yellow), and a slow (blue) quadratic regression line to help the user obtain a clearer picture of current trends. Quadratic regression is better suited to determining (and predicting) trend than linear regression; y = ax^2 + bx + c is better to use than a simple y = ax + b. Calculating the regression involves five summation equations that utilize the bar index (x1), the price source (defaulted to ohlc4), the desired lengths, and the square of x1. Determining the coefficient values requires an additional step that factors in the simple moving average of the source, bar index, and the squared bar index.
In addition to the plotted lines, a change in bar color and a table were added. The bar color is influenced by the values of ax^2 and bx of the fast and medium length regressions. If ax^2 and bx for both the fast and medium lengths are above 0, the bar color is green. If they are both under 0, the bar color is red. Otherwise, bars are colored gray. In the table, located at the bottom of the chart (but can be moved), the ax^2 and bx values for each regression length are shown. The option to view normalized (scale of -1 to +1) values or the standard values is included in the indicator settings menu. By default, the normalized values are shown.
In addition to the plotted lines, a change in bar color and a table were added. The bar color is influenced by the values of ax^2 and bx of the fast and medium length regressions. If ax^2 and bx for both the fast and medium lengths are above 0, the bar color is green. If they are both under 0, the bar color is red. Otherwise, bars are colored gray. In the table, located at the bottom of the chart (but can be moved), the ax^2 and bx values for each regression length are shown. The option to view normalized (scale of -1 to +1) values or the standard values is included in the indicator settings menu. By default, the normalized values are shown.
Protected script
This script is published as closed-source. However, you can use it freely and without any limitations – learn more here.
Disclaimer
The information and publications are not meant to be, and do not constitute, financial, investment, trading, or other types of advice or recommendations supplied or endorsed by TradingView. Read more in the Terms of Use.