OPEN-SOURCE SCRIPT
Price Action Signals
Updated
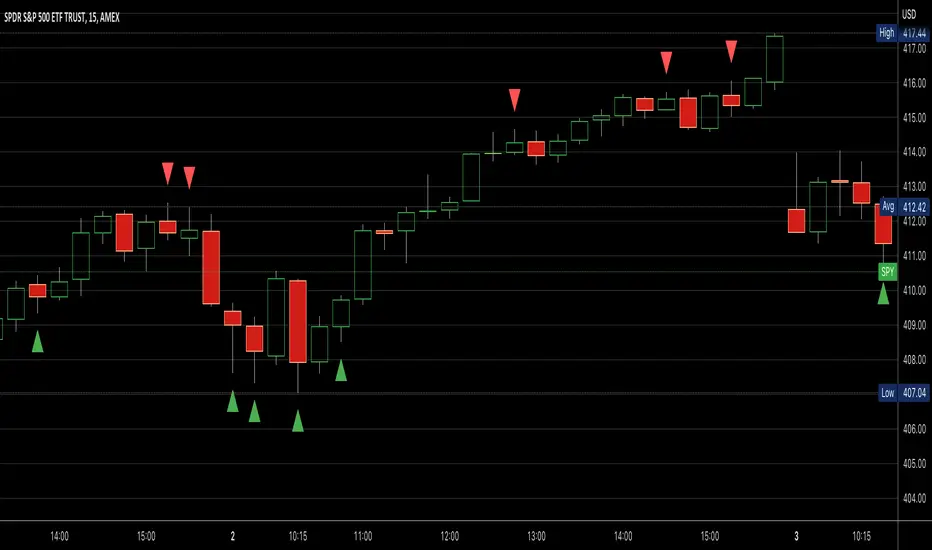
Indicator that shows buy/sell signals based on price action as it relates to a 20 day moving average. If the candle is above the 20 day moving average, we look for candles with long wicks on the top indicating selling pressure. If the candle is below the 20 day moving average we look for candles with a long bottom wick indicating buying pressure. The rules for the wick and the price action can be modified by the user. The two user defined parameters are price movement and wick length.
For instance, the user can choose to only show arrows when candle has moved by X amount. The smaller the timeframe, the smaller the amount. I Recommended the following values when looking at SPY:
On a 1m chart: .10 cents
5min chart: .15 cents
15m chart: .25 cents
1h chart: 1 dollar,
1D chart: 2 dollars
Your mileage will vary.
With the wicks, you choose a percentage. You can choose to only show an arrow above or below a candle if the wick size is at least x% the size of the candle body.
Release Notes
Removed division by 100 for first input, we're taking the actual value, not a percentage.Release Notes
Changed default step value for candle wick length and removed commentary on how to set price value.Release Notes
Modified plot to use triangles instead of arrows. Also further modified the step setting for candle wick length.Release Notes
Modified plot arrows, changed plot.Release Notes
Added ability for user to pick moving average length.Open-source script
In true TradingView spirit, the author of this script has published it open-source, so traders can understand and verify it. Cheers to the author! You may use it for free, but reuse of this code in publication is governed by House rules. You can favorite it to use it on a chart.
Disclaimer
The information and publications are not meant to be, and do not constitute, financial, investment, trading, or other types of advice or recommendations supplied or endorsed by TradingView. Read more in the Terms of Use.