INVITE-ONLY SCRIPT
Automatic Risk to Reward Pivots
Updated
In a nutshell I was tired of guestimating what my risk was between pivots when getting into trades I went to work on the basic math behind the relationship of the pivots to find their natural risk to reward ratios.
The natural risk to rewards span high and low...for example...you can go from the S3 --> R3 and that R:R is with a stop loss of the S4 is 7.4
But making all of those possibilities in code is excessive and for simplicity sake I price can only be between two pivot areas at any point in time.
So this auto risk to reward is limited to the 2:1 opportunities. If you by chance do the math for all of the possibilities as I have then it would be easy to change the Take Profit levels.
I use the fibonacci pivot points in this indicator but I include the mid levels and further extensions totaling 20 levels, 21 including the pivot.
Here they are...the generic plots are bolded...the additional levels are the other fib levels
R7 - 200%
R6 - 162%
R5 - 141%
R4 - 127%
R3 - 100%
R-C - 76%
R2 - 62%
R-B - 50%
R1 - 38%
R-A - 24%
Pivot
S-A - (24%)
S1 - (38%)
S-B - (50%)
S2 - (62%)
S-C - (76%)
S3 - (100%)
S4 - (127%)
S5 - (141%)
S6 - (162%)
S7 - (200%)
The indicator give you the setups for uptrends and downtrends based on the pivot point moving averages (ex. ema(hlc3, 34)) from a higher timeframe which you will be free to change yourself in the inputs.
For my setup, I trade from the daily pivots using the 10m or 5m chart so my next level up is the weekly pivots which I view using the 1H chart candles.
In the next iterations I will add the ability to change the MA lengths.
Pivot Point Moving average lengths
Weekly lengths - fast 34 : slow 55
Monthly lengths - fast 13 : slow 34
Yearly lengths - fast 13 : slow 34
Rules for Uptrends
Fast MA > Slow MA
Session high < r6
Rules for Downtrends
Fast MA < Slow MA
Session high > s6
Timeframes applicable are only those who have a higher pivot set above it
Monthly_SR = 240m, 300m, D
Weekly_SR = 26m, 30m, 60m
Daily_SR = 1m, 3m, 5m, 10m, 15m
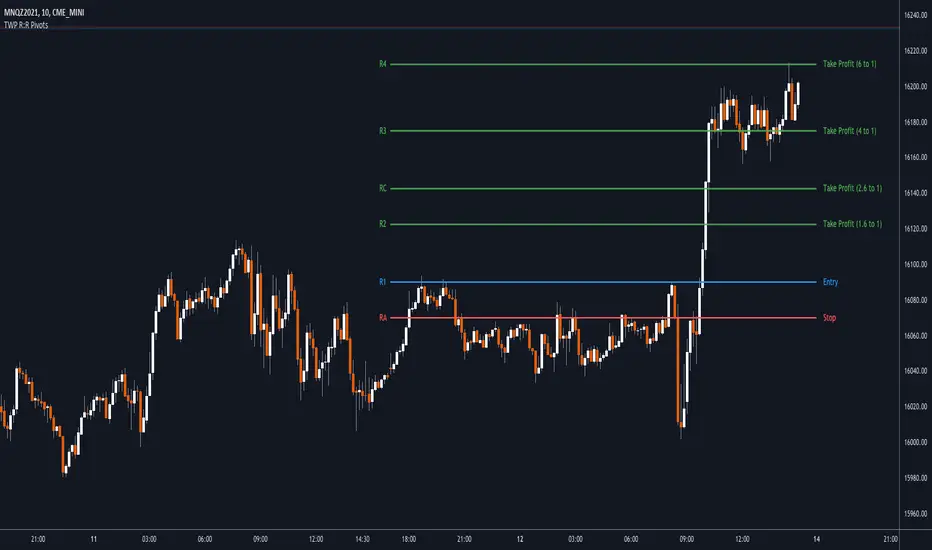
Your take profit line will always populate where your risk will be 2:1
Your stop loss will always be one pivot level underneath or above your entry
Feel free to ask any questions. Trade well my friends!
The natural risk to rewards span high and low...for example...you can go from the S3 --> R3 and that R:R is with a stop loss of the S4 is 7.4
But making all of those possibilities in code is excessive and for simplicity sake I price can only be between two pivot areas at any point in time.
So this auto risk to reward is limited to the 2:1 opportunities. If you by chance do the math for all of the possibilities as I have then it would be easy to change the Take Profit levels.
I use the fibonacci pivot points in this indicator but I include the mid levels and further extensions totaling 20 levels, 21 including the pivot.
Here they are...the generic plots are bolded...the additional levels are the other fib levels
R7 - 200%
R6 - 162%
R5 - 141%
R4 - 127%
R3 - 100%
R-C - 76%
R2 - 62%
R-B - 50%
R1 - 38%
R-A - 24%
Pivot
S-A - (24%)
S1 - (38%)
S-B - (50%)
S2 - (62%)
S-C - (76%)
S3 - (100%)
S4 - (127%)
S5 - (141%)
S6 - (162%)
S7 - (200%)
The indicator give you the setups for uptrends and downtrends based on the pivot point moving averages (ex. ema(hlc3, 34)) from a higher timeframe which you will be free to change yourself in the inputs.
For my setup, I trade from the daily pivots using the 10m or 5m chart so my next level up is the weekly pivots which I view using the 1H chart candles.
In the next iterations I will add the ability to change the MA lengths.
Pivot Point Moving average lengths
Weekly lengths - fast 34 : slow 55
Monthly lengths - fast 13 : slow 34
Yearly lengths - fast 13 : slow 34
Rules for Uptrends
Fast MA > Slow MA
Session high < r6
Rules for Downtrends
Fast MA < Slow MA
Session high > s6
Timeframes applicable are only those who have a higher pivot set above it
Monthly_SR = 240m, 300m, D
Weekly_SR = 26m, 30m, 60m
Daily_SR = 1m, 3m, 5m, 10m, 15m
Your take profit line will always populate where your risk will be 2:1
Your stop loss will always be one pivot level underneath or above your entry
Feel free to ask any questions. Trade well my friends!
Release Notes
Release Notes: v1.1Fixed the repainting issue
Added labels on the other side of the pivot to label which pivot is showing for the TP, Entry and SL, respectively.
Release Notes
Release Notes: v1.2Cleared out unused code
Release Notes
Release Notes: v1.3Corrected trend identification
Corrected bull sentiment syntax for TF using the monthly period
reduced use of the security function to increase compile time
Release Notes
Release Notes: Release Notes: v1.4Color inputs added
Release Notes
Release Notes: v 1.5Drastically reduced compile time
Removed small bug where old lines would show
Release Notes
v1.6More code clean up and taken care of the repainting issue.
Just wanted to a drop a gentle reminder that this tool is best used when along side the Standard Fibonacci Pivot Points.
The tool produces 2:1 risk to reward trades as the prices progresses through the periods pivots, it is not a static tool...I plan to add that functionality at a different date.
You will find that the default TV pivot point indicator does not the A,B,C...etc levels that the tool may show. That is ok. Those levels are added fibonacci ratios that you can find on my script Standard Fibonacci Pivot Points
The tool populates for longs or short based on two exponential moving averages which I had added an input for so you can change them yourself.
Release Notes
v2.0This is a complete overhaul of the script see updates below
█ OVERVIEW
• Script is 10x faster
• Added ability to FREEZE levels into place for after you have entered your trades
• Can choose your entry manually
• Now shows 1 to 1, 2 to 1, 3 to 1 and 4 to 1 trading opportunities
• Labeling is significantly better allowing this tool to be used without the use of the Standard Fibonacci Pivot Points indicator
• Added tooltips explaining
• Lines will populate correctly for any timeframe
• Removed directional logic
• Added ability to choose whether to show LONG or SHORT trading opportunities
• Complete control over line styles and colors
█ HOW TO USE
• The script can be used as an overlay of the Standard Fibonacci Pivot Point Indicator or as a standalone tool
1 — add to chart
2 — using the pivot levels and your trading methodology, find a favorable entry
3 — use the long or short position tool provided by tradingview to place trading orders at the levels provided on the chart (Entry, Stop Loss, Take Profit)
4 — If you are using multiple TPs you will have to manually add the order in
Release Notes
v2.1█ OVERVIEW
• Added a new input 'System Type' which gives you the ability to risk either a half pivot level or a full pivot level
• Examples
• Half Level — Entry: R1; Stop Loss: R-A
• Full Level — Entry: R1; Stop Loss: Pivot
Invite-only script
Access to this script is restricted to users authorized by the author and usually requires payment. You can add it to your favorites, but you will only be able to use it after requesting permission and obtaining it from its author. Contact Jauqius for more information, or follow the author's instructions below.
Please note that this is a private, invite-only script that was not analyzed by script moderators. Its compliance to House Rules is undetermined. TradingView does not suggest paying for a script and using it unless you 100% trust its author and understand how the script works. In many cases, you can find a good open-source alternative for free in our Community Scripts.
Author's instructions
″Please visit our website to attain access to the script. Tradingwithpivots.com
Want to use this script on a chart?
Warning: please read before requesting access.
Disclaimer
The information and publications are not meant to be, and do not constitute, financial, investment, trading, or other types of advice or recommendations supplied or endorsed by TradingView. Read more in the Terms of Use.