OPEN-SOURCE SCRIPT
Swing Points [Syafiq.Jr]
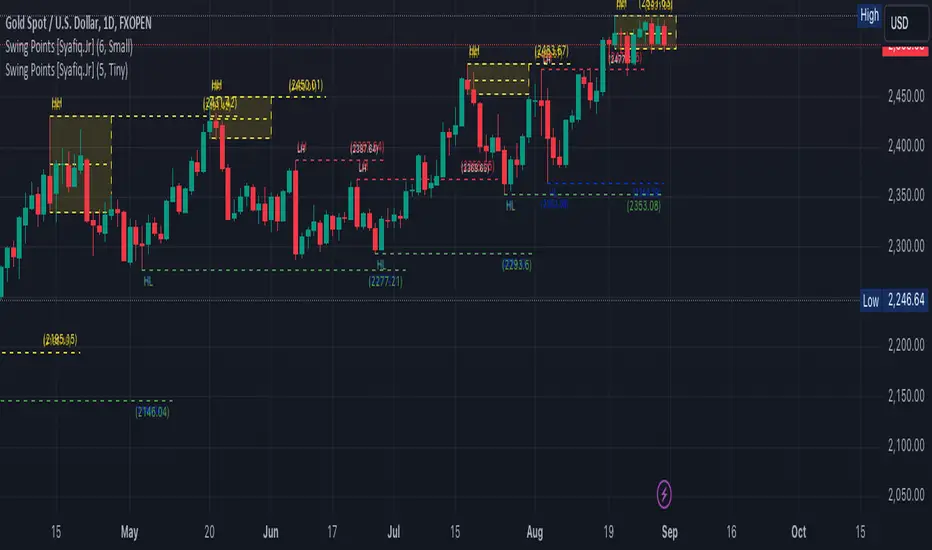
The Swing Points indicator by Syafiq.Jr is designed to identify and visualize pivotal market structures such as Higher Highs (HH), Lower Highs (LH), Lower Lows (LL), and Higher Lows (HL) directly on the chart. This tool is essential for traders who utilize swing trading strategies and rely on understanding market trends through key price levels.
Key Features:
Pivot Strength: Configurable pivot strength to customize the sensitivity of swing points.
Customizable Visuals: Users can adjust the colors and visibility of the zones for each swing point category (HH, LH, LL, HL) based on their preferences.
Multiple Timeframe Support: The indicator offers the flexibility to display swing points from the current timeframe or higher timeframes such as 5-minute, 15-minute, 30-minute, 1-hour, 4-hour, and daily intervals.
Dynamic Extension Lines: Automatically extend key levels across the chart for ongoing reference.
Configurable Font Sizes: Adjust the font size for labels marking the swing points to ensure clear visualization.
This indicator is ideal for traders who need to spot and track critical swing points across different timeframes, enabling better decision-making in trending and ranging markets.
Open-source script
In true TradingView spirit, the author of this script has published it open-source, so traders can understand and verify it. Cheers to the author! You may use it for free, but reuse of this code in publication is governed by House rules. You can favorite it to use it on a chart.
Disclaimer
The information and publications are not meant to be, and do not constitute, financial, investment, trading, or other types of advice or recommendations supplied or endorsed by TradingView. Read more in the Terms of Use.