OPEN-SOURCE SCRIPT
Stef's Money Supply Indicator
Updated
I have been fascinated by the growth in the Money Supply. Well, I think we ALL have been fascinated by this and the corresponding inflation that followed. That's why I created my Money Supply Indicator because I always wanted to chart and analyze my symbols based on the Money Supply. This indicator gives you that capability in a way that no other indicator in this field currently offers. Let me explain:
How does the indicator work?
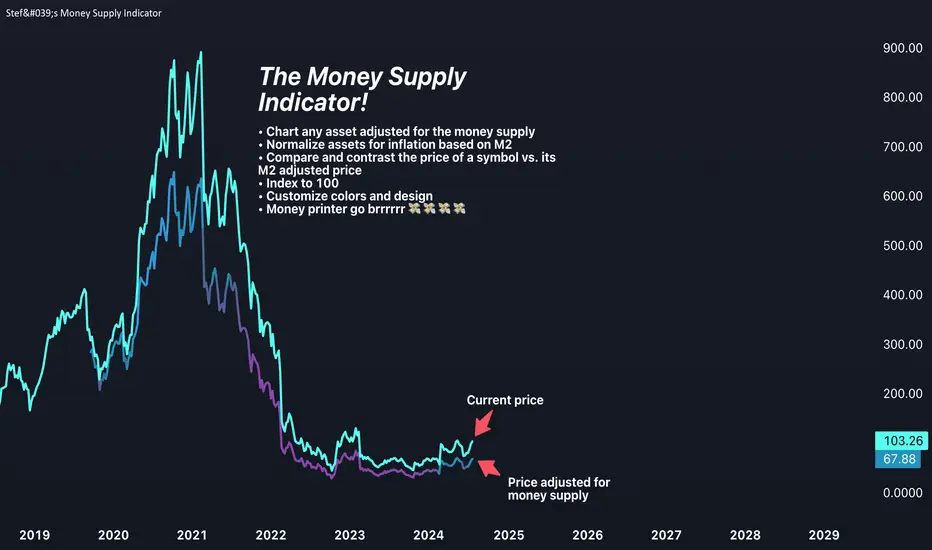
Chart any symbol, turn on this indicator, and instantly it will factor in the M2 money supply on the asset's underlying price. Essentially, you are seeing the price of the asset normalized for the corresponding rise in the money supply. In some ways, this is a rather unique inflation-adjusted view of a symbol's price.
More importantly, you can compare and contrast the symbol's price adjusted for the rise in the Money Supply vs. the symbol's price without that adjustment by indexing all lines to 100. This is essential for understanding if the asset is at all-time highs, lows, or possibly undervalued or overvalued based on the current money supply situation.
Why does this matter?
This tool provides a deeper understanding of how the overall money supply influences the value of assets over time. By adjusting asset prices for changes in the money supply, traders can see the true value of assets relative to the amount of money in circulation.
What features can you access with this indicator?
The ability to normalize all lines to a starting point of 100 allows traders to compare the performance of the Money Supply, the symbol price, and the symbol price adjusted for the money supply all on one readable chart. This feature is particularly useful for spotting divergences and understanding relative performance over time with a rising or falling Money Supply.
What else can you do?
This is just version 1, and so I'll be adding more features rather soon, but there are two other important features in the settings menu including the following:
• Get the capability to quickly spot the highest and lowest points on the Money Supply adjusted price of your asset.
• Get the capability to change the gradient colors of the line when going up or down.
• Turn on the Brrrrrrr printer text as a reminder of our Fed Overlord Jerome Powell... lol
• Drag this indicator onto your main chart to combine it with your candlesticks or other charting techniques.
Stef's Money Supply Indicator! I look forward to hearing your feedback.
How does the indicator work?
Chart any symbol, turn on this indicator, and instantly it will factor in the M2 money supply on the asset's underlying price. Essentially, you are seeing the price of the asset normalized for the corresponding rise in the money supply. In some ways, this is a rather unique inflation-adjusted view of a symbol's price.
More importantly, you can compare and contrast the symbol's price adjusted for the rise in the Money Supply vs. the symbol's price without that adjustment by indexing all lines to 100. This is essential for understanding if the asset is at all-time highs, lows, or possibly undervalued or overvalued based on the current money supply situation.
Why does this matter?
This tool provides a deeper understanding of how the overall money supply influences the value of assets over time. By adjusting asset prices for changes in the money supply, traders can see the true value of assets relative to the amount of money in circulation.
What features can you access with this indicator?
The ability to normalize all lines to a starting point of 100 allows traders to compare the performance of the Money Supply, the symbol price, and the symbol price adjusted for the money supply all on one readable chart. This feature is particularly useful for spotting divergences and understanding relative performance over time with a rising or falling Money Supply.
What else can you do?
This is just version 1, and so I'll be adding more features rather soon, but there are two other important features in the settings menu including the following:
• Get the capability to quickly spot the highest and lowest points on the Money Supply adjusted price of your asset.
• Get the capability to change the gradient colors of the line when going up or down.
• Turn on the Brrrrrrr printer text as a reminder of our Fed Overlord Jerome Powell... lol
• Drag this indicator onto your main chart to combine it with your candlesticks or other charting techniques.
Stef's Money Supply Indicator! I look forward to hearing your feedback.
Release Notes
Added a feature in the Settings menu to create a custom moving average so that you can smooth out the Money Supply indicator over time and compare vs. contrast it with the raw data and/or other pricing data.Leading TradingView's educational videos on Youtube: youtube.com/channel/UCfOflihrkOKDQZ_ZKtF2VfQ
Read my blog here: scheplick.com
Follow me on X here: x.com/scheplick
Read my blog here: scheplick.com
Follow me on X here: x.com/scheplick
Open-source script
In true TradingView spirit, the author of this script has published it open-source, so traders can understand and verify it. Cheers to the author! You may use it for free, but reuse of this code in publication is governed by House rules. You can favorite it to use it on a chart.
Disclaimer
The information and publications are not meant to be, and do not constitute, financial, investment, trading, or other types of advice or recommendations supplied or endorsed by TradingView. Read more in the Terms of Use.