OPEN-SOURCE SCRIPT
Price Acceleration Indicator (PAI)
Updated

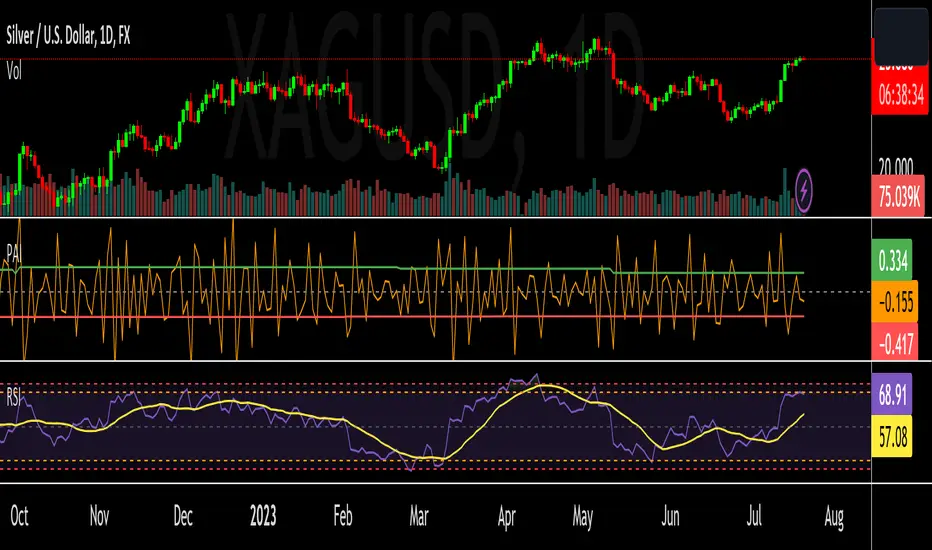
I have designed a "Price Acceleration" Indicator (PAI). It tracks the second derivative in price movements. This is different from ROC as that one measures Price Velocity rather than Acceleration. This Indicator should give you an idea of when the steam has come out of a move, or when one is getting started. For example, if RSI is reaching overbought, and PAI is Negative, that means the move is slowing down and likely to give in to the opposite direction soon.
Release Notes
UPDATED to have Buy and Sell threshold lines:When the Indicator crosses the Buy Line, you can enter a Buy trade and expect to exit once the Indicator has peaked towards +1.
When the Indicator crosses the Sell Line, you can enter a Sell trade and expect to exit once the Indicator has peaked towards -1.
Release Notes
UPDATE: Indicator now adds as a separate pane automatically. I've also updated the BUY/SELL Threshold lines to automatically be set at 30% of the previous peaks. This will give you an idea when the price is accelerating in one direction or another.Open-source script
In true TradingView spirit, the author of this script has published it open-source, so traders can understand and verify it. Cheers to the author! You may use it for free, but reuse of this code in publication is governed by House rules. You can favorite it to use it on a chart.
Disclaimer
The information and publications are not meant to be, and do not constitute, financial, investment, trading, or other types of advice or recommendations supplied or endorsed by TradingView. Read more in the Terms of Use.