PROTECTED SOURCE SCRIPT
Updated Rails [s3]

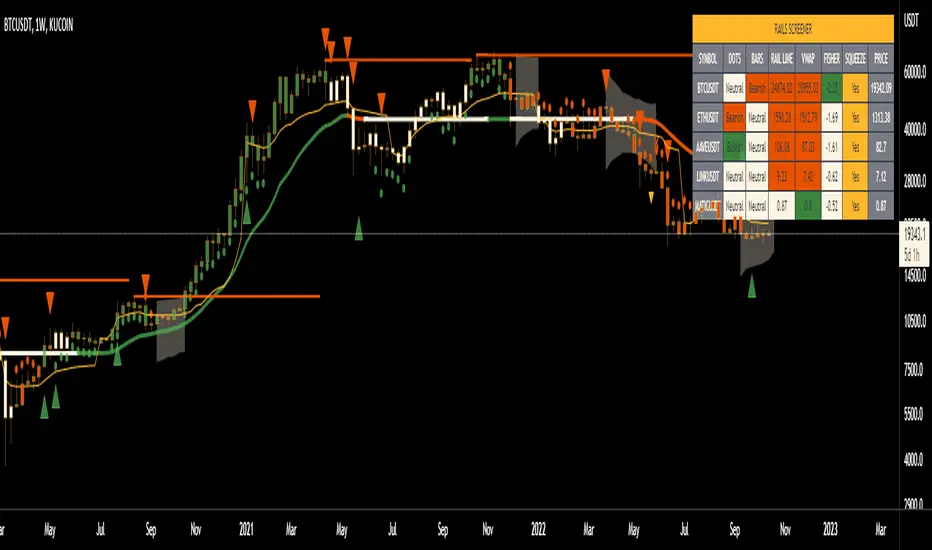
Centered around a Variable Moving Average. The Variable Moving Average (VMA) is a study that uses an Exponential Moving Average being able to automatically adjust its smoothing factor according to the market volatility. In addition to the VMA, the indicator displays breakouts in volume and when the Bollinger Bands are in a squeeze.
Dots = Microtrend
Triangles = Breakouts in Volume
X = Crossover of Moving Averages
Shaded "Cloud" = Bollinger Bands Squeeze
Alerts can be set for Bearish and Bullish strength (Volume Breakouts), Crossovers, and when Squeezes have started and ended.
Dots = Microtrend
Triangles = Breakouts in Volume
X = Crossover of Moving Averages
Shaded "Cloud" = Bollinger Bands Squeeze
Alerts can be set for Bearish and Bullish strength (Volume Breakouts), Crossovers, and when Squeezes have started and ended.
Release Notes
Made UX changes.
Release Notes
Added Murrey Math Lines Channel to indicator.
Release Notes
Fixed shape location and allowed user input to turn on/off Murrey lines
Release Notes
Refined Shape Offset
Release Notes
Added exhaustion levels; set default value for exhaustion levels to on; set default value for Murrey lines to off
Release Notes
Updated chart picture
Release Notes
Fixed spelling error
Release Notes
Tuned squeeze settings
Release Notes
Updated alert messages and code optimized
Release Notes
- Added Screener
- Added diamond symbol to forecast squeeze direction (still confirmed by volume breakout arrow)
Release Notes
-Aesthetic changes
Release Notes
- Added VWAP weighted for volatility- Added ability to see squeezes on higher TF than chart
- Changed normalized volume to show (bigger red/green triangles) whenever above 50 MA
Protected script
This script is published as closed-source. However, you can use it freely and without any limitations – learn more here.
Disclaimer
The information and publications are not meant to be, and do not constitute, financial, investment, trading, or other types of advice or recommendations supplied or endorsed by TradingView. Read more in the Terms of Use.