PROTECTED SOURCE SCRIPT
FTX BTC Move Trend [Ryto]
Updated

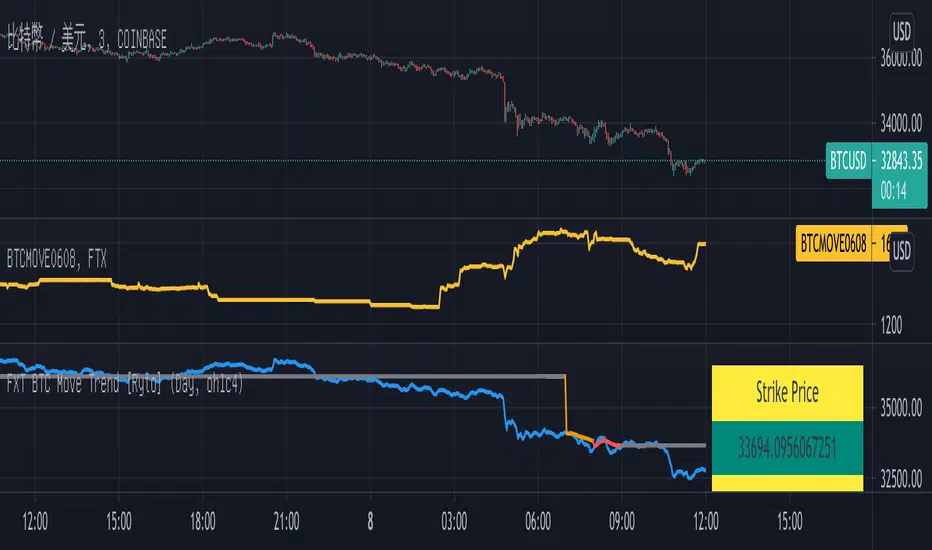
This indicator helps intuitively see the trend between FTX move contract's strike price (Daily or Weekly) and the index price of BTC.
- Blue curve: FTX BTC index price.
- Red curve: 00:00:00-00:59:59 UTC+00:00 BTC index price TWAP.
- Orange curve: 23:00:00-23:59:59 UTC+00:00 BTC index price TWAP.
- Grey curve: The strike price of a move contract.
When the blue curve is near the grey curve, that represents the current index price is near to the strike price of a move contract. Cooperate with other indicators and observe the BTC trend also consider move contract price to decide whether to buy or sell.
Note: Should use the timeframe lower than 5 minutes, to ensure the correct TWAP price.
Reference:
- https://help.ftx.com/hc/en-us/articles/360027668812-Index-Calculation
- https://help.ftx.com/hc/en-us/articles/360033136331-MOVE-contracts
- https://www.tradingview.com/pine-script-docs/en/v4/essential/Context_switching_the_security_function.html#requesting-data-of-a-lower-timeframe
---------------------------------------------------------------------------------------------------------------------------------------------------------------
這個指標適用在觀察 FTX 波動率產品 (日與週波動率合約),可以更直覺的看出 FTX BTC 指數價格與波動率產品行權價的走勢關係。
- 藍色曲線: BTC 指數價格
- 紅色曲線: 00:00:00-00:59:59 UTC+00:00 BTC 指數價格之時間加權平均
- 橘色曲線: 23:00:00-23:59:59 UTC+00:00 BTC 指數價格之時間加權平均
- 灰色曲線: 波動率產品行權價
當藍色曲線在灰色曲線附近,代表此時指數價格在行權價附近,配合其他指標觀察 BTC 走勢與波動率價格來決定是否買入或賣出波動率。
注意: 需使用時匡為 5 分鐘以下,確保指數價格之時間加權平均計算正確。
參考:
- https://help.ftx.com/hc/zh-cn/articles/360027937891-%E6%8C%87%E6%95%B0%E8%AE%A1%E7%AE%97%E8%A7%84%E5%88%99
- https://help.ftx.com/hc/zh-cn/articles/360033349672-%E5%8F%8C%E5%90%91%E6%9C%9F%E6%9D%83%E5%90%88%E7%BA%A6 (MOVE 合约)
- Pine 腳本時匡限制
Release Notes
Fix typo.Disclaimer
The information and publications are not meant to be, and do not constitute, financial, investment, trading, or other types of advice or recommendations supplied or endorsed by TradingView. Read more in the Terms of Use.