OPEN-SOURCE SCRIPT
Keltner | Bollinger | Squeeze
Updated
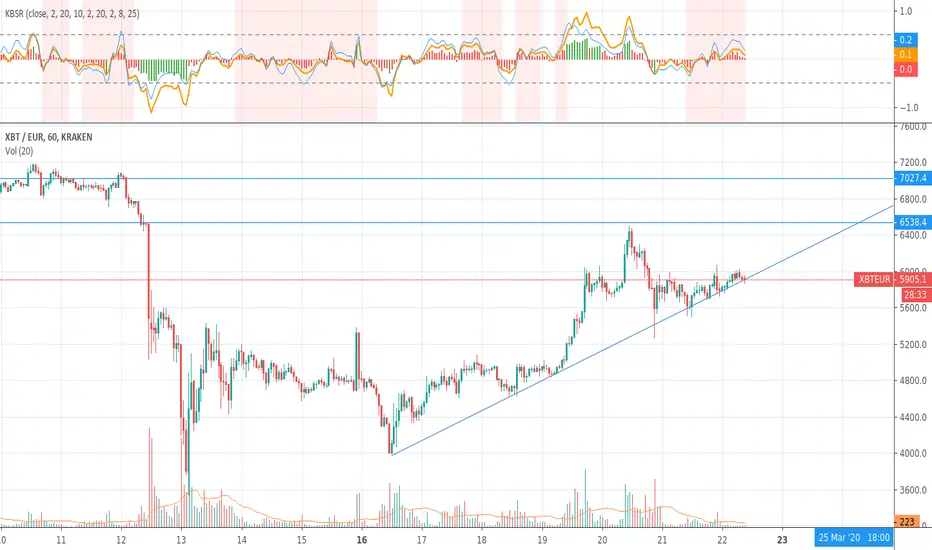
Percent B (%B), it's derivation Percent K (%K) and squeeze indicator combined in one.
blue line = bollinger %
orange line = keltner %
red background = squeeze*
squeeze = bollinger bands are inside (encapsulated by) keltner channel
blue line = bollinger %
orange line = keltner %
red background = squeeze*
squeeze = bollinger bands are inside (encapsulated by) keltner channel
Release Notes
Fixed squeeze calculation.Release Notes
Added scaled RSI indicator - let's call it rsi_2 - which is calculated in following way:> rsi_2 = (rsi / 100) - 0.5
RSI is now plotted as histogram, where
- green color = overbought / oversold market
- red color = normal
* This indicator was created primarly for my own purposes, all comments and suggestions are welcome.
Release Notes
Added smoothing parameter to %B and %K.Note: Indicator works best with 30min+ time-frames.
Open-source script
In true TradingView spirit, the author of this script has published it open-source, so traders can understand and verify it. Cheers to the author! You may use it for free, but reuse of this code in publication is governed by House rules. You can favorite it to use it on a chart.
Disclaimer
The information and publications are not meant to be, and do not constitute, financial, investment, trading, or other types of advice or recommendations supplied or endorsed by TradingView. Read more in the Terms of Use.