OPEN-SOURCE SCRIPT
SynthSAR Confirmation
Updated
This indicator represents confirmation of a trend based on the PSAR indicator and includes signals from the MACD, stochastic oscillator, and awesome oscillator. It displays the points of the parabolic SAR on the chart, which help determine the direction of the trend. Additionally, the indicator allows for tracking signals based on the combined analysis of three other technical indicators: MACD, stochastic oscillator, and awesome oscillator. Furthermore, the indicator includes the ability to display buy/sell labels and signals for changing the trend direction. This is not an investment recommendation.Very effective in higher timeframes.If the MACD "macd line" crosses the "signal line" from above and the Stochastic %K line crosses the %D line from above, and the last column in the Avesome Oscillator is red, then the indicator gives a signal to sell. If the MACD "macd line" crosses the "signal line" from below and the Stochastic %K line crosses the %D line from below, and the last column in the Avesome Oscillator is green, then the indicator gives a signal to buy.
Release Notes
This indicator signals a trend reversal, so each signal needs to be carefully verified. It provides a good signal when levels are broken, during retests, and on pullbacks.Release Notes
Fixed some bugsRelease Notes
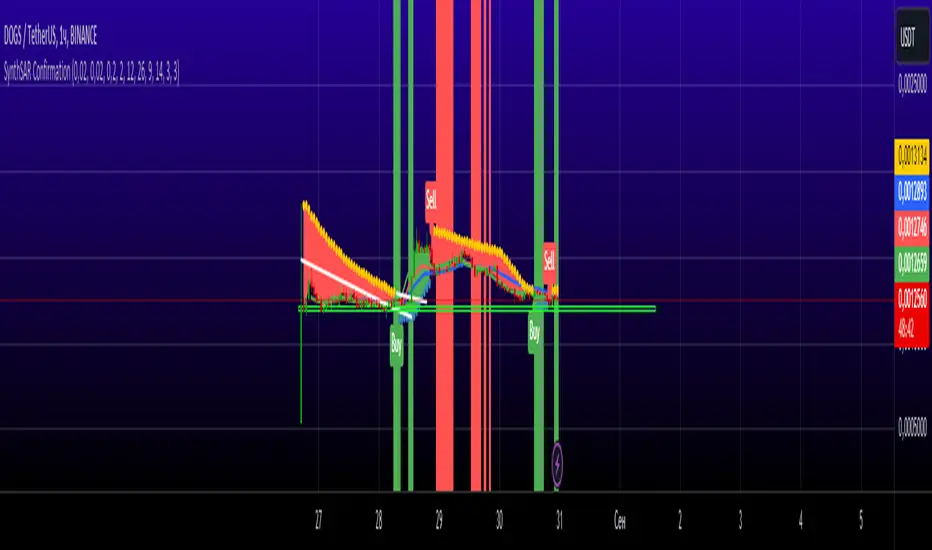
The 3-EMA Breakout System add-onSo, let's look at examples of opening trades based on signals from The 3-EMA Breakout System:
We apply 3 EMA indicators to the price chart. They should be of different colors for convenience. For the first EMA, we set a period of 21 and a shift of -2 (blue). For the second EMA, we set a period of 14 and a shift of -3 (red). For the third EMA, we set a period of 9 and a shift of -4 (green).
Thus, the blue EMA will be the slowest, and when it is crossed by other faster EMAs, we will receive signals to open trades.
A sell signal occurs when the green EMA crosses the red EMA from top to bottom, and together they cross the blue EMA from top to bottom (Sell 1,3,5).
A buy signal occurs when the green EMA crosses the red EMA from bottom to top, and together they cross the blue EMA from bottom to top (Buy 2,4).
The system does not have fixed levels for Take Profit and Stop Loss orders, and it is necessary to exit trades based on the actual situation.
A trade should be closed with profit or loss when the green and red EMAs cross again after the trade is opened.
As you can see, this Forex trading system is also quite simple. The simplest averaging indicator provides clear and understandable signals with a ratio of profitable and losing trades of about 70/30.
Release Notes
SynthSAR Confirmation IndicatorThe SynthSAR Confirmation Indicator combines multiple technical analysis tools into a comprehensive trading system. It includes three Exponential Moving Averages (EMA), the Parabolic SAR (PSAR), the MACD, Stochastic Oscillator, and the Awesome Oscillator to provide reliable entry and exit signals.Key Features:EMA Crossovers: The indicator plots three EMAs (9, 14, and 21 periods) to help identify trend direction.Parabolic SAR: It highlights the trend direction and signals potential reversal points. Buy and sell signals are generated when the PSAR flips its position relative to the price.MACD and Stochastic Oscillator: These oscillators are used to confirm the strength of a trend or signal, with the MACD providing momentum analysis and the Stochastic Oscillator showing overbought or oversold conditions.Awesome Oscillator: This helps in identifying the market momentum and confirming the strength of buy or sell signals.Combined Signal Confirmation: The indicator integrates signals from the MACD, Stochastic, and Awesome Oscillator to provide a unified signal for market direction.Visual Aids: The indicator provides clear visual signals on the chart, including highlighted start points for long and short trades, and labels for buy/sell actions.Usage:The indicator is best used in trending markets, where it helps in identifying entry and exit points based on the combined analysis of several indicators.Ideal for traders looking for a systematic approach to trading with confirmations from multiple technical indicators.
Open-source script
In true TradingView spirit, the author of this script has published it open-source, so traders can understand and verify it. Cheers to the author! You may use it for free, but reuse of this code in publication is governed by House rules. You can favorite it to use it on a chart.
Disclaimer
The information and publications are not meant to be, and do not constitute, financial, investment, trading, or other types of advice or recommendations supplied or endorsed by TradingView. Read more in the Terms of Use.