OPEN-SOURCE SCRIPT
Support/Resistance

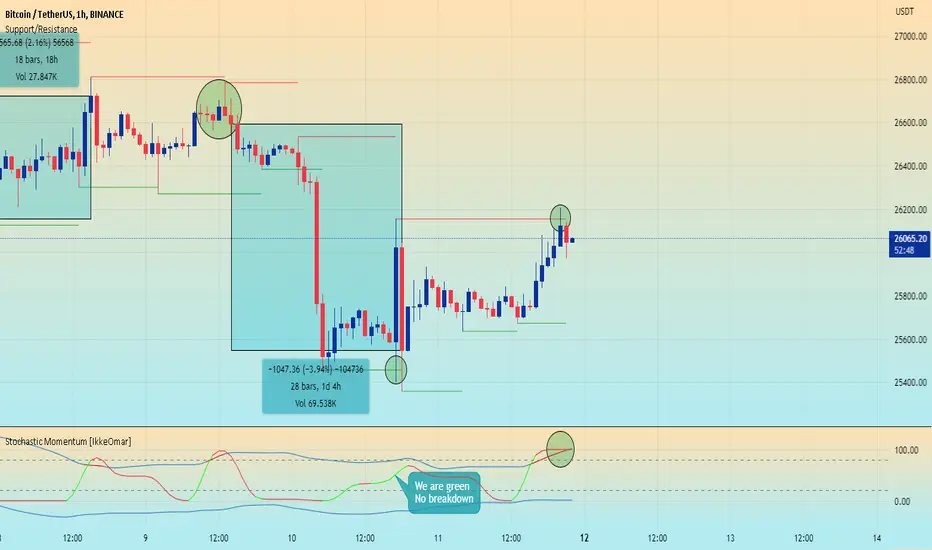
Use this code to stop support and resistance
This can be used with the momentum indicators that I have to see if we are likely to breakout or get rejected
Indicator Settings:
The indicator is titled "Support/Resistance | Breaks & Bounces" and is set to overlay on the price chart.
max_lines_count is set to 500, indicating the maximum number of support/resistance lines that can be plotted.
User Input:
The script allows users to customize the pivot method, sensitivity, and line width through input variables.
point_method determines whether the pivot calculation is based on "Candle Wicks" or "Candle Body".
left_bars represents the number of bars to the left used to identify pivot highs/lows.
right_bars is set equal to left_bars.
line_width controls the width of the support/resistance lines.
Global Variables and Arrays:
The script declares several variables and arrays to store information related to support and resistance levels, breakouts, and bounces.
high_source and low_source are calculated based on the selected pivot method.
fixed_pivot_high and fixed_pivot_low store the pivot highs and lows using the chosen sensitivity.
Variables and arrays are initialized for tracking support/resistance lines, breakout triggers, and bounce triggers.
Main Operation:
The main operation occurs when barstate.isconfirmed is true, indicating that a new bar has formed and its data is final.
The script iterates through the support/resistance lines to update their end points (x2) to the current bar.
For each support/resistance line, it checks if a breakout or bounce event has occurred based on the current and previous bar's price levels.
If a breakout or bounce event is detected, the corresponding trigger variables (red_breakout_trigger, red_rejection_trigger, green_breakout_trigger, green_rejection_trigger) are set to true.
The script also checks for changes in the pivot highs and lows and updates the support/resistance lines accordingly.
If a change is detected, it clears the existing lines, breakout, and bounce arrays and adds new lines for the updated pivot levels.
Open-source script
In true TradingView spirit, the author of this script has published it open-source, so traders can understand and verify it. Cheers to the author! You may use it for free, but reuse of this code in publication is governed by House rules. You can favorite it to use it on a chart.
Join my community where i share signals and my secret algos:
Telegram:
t.me/ikkeomarfree
I can also pass funded accounts for you!
$50,000 accounts
Just dm my Telegram @IkkeOmar
Telegram:
t.me/ikkeomarfree
I can also pass funded accounts for you!
$50,000 accounts
Just dm my Telegram @IkkeOmar
Disclaimer
The information and publications are not meant to be, and do not constitute, financial, investment, trading, or other types of advice or recommendations supplied or endorsed by TradingView. Read more in the Terms of Use.