OPEN-SOURCE SCRIPT
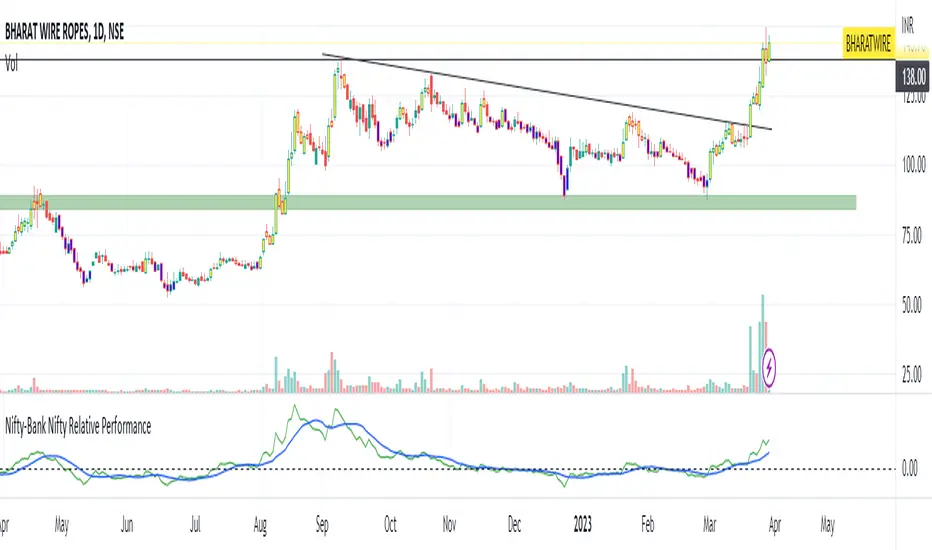
Relative Performance of stock against nifty & bank nifty

The code calculates the relative performance of Nifty and Bank Nifty and plots it on a chart. It also calculates the 14-day RSI and a moving average of the relative performance.
First, the script retrieves the daily close prices for Nifty and Bank Nifty from the NSE using the request.security() function. It then calculates the daily returns for each index and the average returns over a specified lookback period. The relative performance is then calculated as the difference between the current close price and its moving average, expressed as a percentage of the moving average, minus the average daily returns of Nifty and Bank Nifty.
The script then calculates the 14-day RSI using the ta.rsi() function and plots the relative performance on the chart in green color. A signal line at zero is also plotted in black color. Additionally, the moving average of the relative performance is plotted on the chart using the ta.sma() function and an input variable called "interval" is used to specify the number of bars to use for the moving average.
Finally, the script sets the color of the chart bars based on the relative performance and RSI values. If the relative performance is above the moving average and the RSI is above 50, the color of the bars is set to yellow. If the relative performance is below the moving average and the RSI is below 50, the color of the bars is set to a shade of purple.
Open-source script
In true TradingView spirit, the author of this script has published it open-source, so traders can understand and verify it. Cheers to the author! You may use it for free, but reuse of this code in publication is governed by House rules. You can favorite it to use it on a chart.
Disclaimer
The information and publications are not meant to be, and do not constitute, financial, investment, trading, or other types of advice or recommendations supplied or endorsed by TradingView. Read more in the Terms of Use.