OPEN-SOURCE SCRIPT
Coppock Curve Strategy
Updated
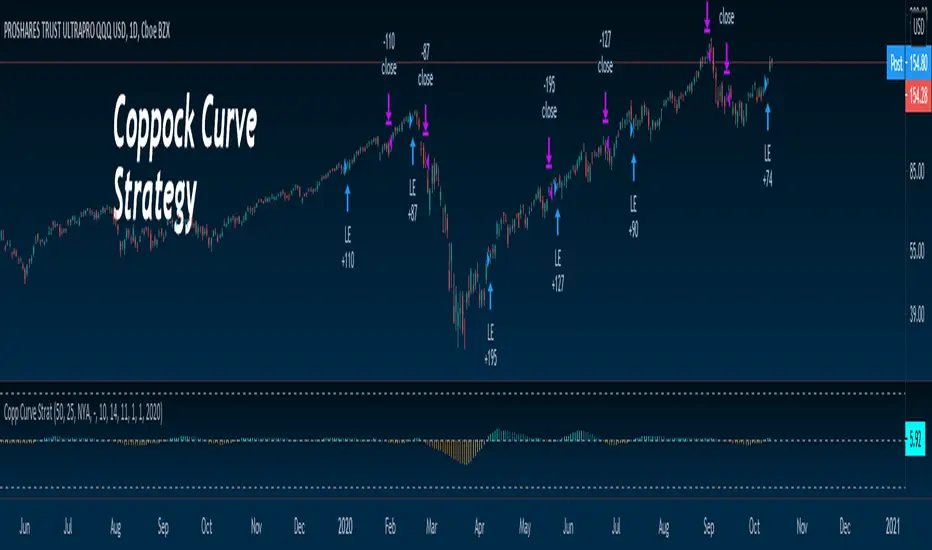
This strategy makes use of a not widely known technical indicator called "Coppock Curve".
The indicator is derived by taking a weighted moving average of the rate-of-change (ROC) of a market index such as the S&P 500 or a trading equivalent such as the S&P 500 SPDR ETF. For more info: (investopedia.com/articles/active-trading/031814/using-coppock-curve-generate-stock-trade-signals.asp)
This strategy uses SPY Coppock curve as a proxy to generate buy signals on other ETF's and stocks.
Buy signals are generated when the Coppock Curve crosses above zero, and sell signals are generated when it crosses below.
An optional, trailing stop loss is available, with default settings to 100% so that it does not currently affect the buy and sell signals solely generated by the Coppock Curve. But you may find adding a Trailing stop loss may improve results on certain ETF's/Stocks.
You may also change the symbol for which signals are generated for, default is SPY.
The published example shows using this strategy on a leverage ETF TQQQ w/ starting capital of 10k, w/ 10k per trade. Try it on other stocks such as
  AAPL,
AAPL,  AMZN
AMZN  NFLX ect... I have found it to be an effective strategy that has a favorable risk to reward profile.
Any questions, please let me know!
The indicator is derived by taking a weighted moving average of the rate-of-change (ROC) of a market index such as the S&P 500 or a trading equivalent such as the S&P 500 SPDR ETF. For more info: (investopedia.com/articles/active-trading/031814/using-coppock-curve-generate-stock-trade-signals.asp)
This strategy uses
Buy signals are generated when the Coppock Curve crosses above zero, and sell signals are generated when it crosses below.
An optional, trailing stop loss is available, with default settings to 100% so that it does not currently affect the buy and sell signals solely generated by the Coppock Curve. But you may find adding a Trailing stop loss may improve results on certain ETF's/Stocks.
You may also change the symbol for which signals are generated for, default is SPY.
The published example shows using this strategy on a leverage ETF
Any questions, please let me know!
Release Notes
MAJOR improvement made to this strategy, really excited for everyone!Originally I had optional trailing %stop loss coded, but after a lot of back-testing I was finding it virtually useless. Noticing substantial % run ups, I decided to implement a % based target, and this dramatically improved results.
Default % based profit target settings are set for
Win rate % has dramatically improved with this setting. Also, you can set the Take profit % tighter, say 5%... this will produce win rates over 80% which is incredible, but the win/loss ratio will be much smaller. So the options here are great for longer term and shorter term traders.
I also changed the ticker which calculates Coppock Curve from SPY to NYA as this also improved results.
Any questions, please let me know!
Release Notes
Accidentally changed the Default length of WMA to 50, from 10. I reset it, however, I added a not to change the WMA to longer lengths for less trades but higher win %. Release Notes
Added instructions to suggest doubling default copp settings, which can produce higher win rates, and lower trades (which may suit certain trading styles). Also changed Copp Curve from Line to Histogram.
Release Notes
More instructions embedded Release Notes
Couple Updates:1. Time stamp so you can test from a different start date
2. I use this exclusively on daily time frame, but you can now switch resolution and test intraday
3. Had to change the color scheme because Indicators that don't POP just aren't as fun.
Open-source script
In true TradingView spirit, the author of this script has published it open-source, so traders can understand and verify it. Cheers to the author! You may use it for free, but reuse of this code in publication is governed by House rules. You can favorite it to use it on a chart.
Disclaimer
The information and publications are not meant to be, and do not constitute, financial, investment, trading, or other types of advice or recommendations supplied or endorsed by TradingView. Read more in the Terms of Use.