OPEN-SOURCE SCRIPT
Pro RSI Calculator

The "Pro RSI Calculator" indicator is the latest addition to a series of custom trading tools that includes the "Pro Supertrend Calculator" and the "Pro Momentum Calculator."
Building upon this series, the "Pro RSI Calculator" is designed to provide traders with further insights into market trends by leveraging the Relative Strength Index (RSI) indicator.
Its primary objective remains consistent: to analyze historical price data and make informed predictions about future price movements, with a specific focus on identifying potential bullish (green) or bearish (red) candlestick patterns.
1. RSI Calculation:
The indicator begins by computing the RSI, a widely used momentum oscillator. It calculates two crucial RSI parameters:
RSI Length: This parameter determines the lookback period for RSI calculations.
RSI Upper and Lower Bands: These thresholds define overbought and oversold conditions, typically set at 70 and 30, respectively.
2. RSI Bands Visualization:
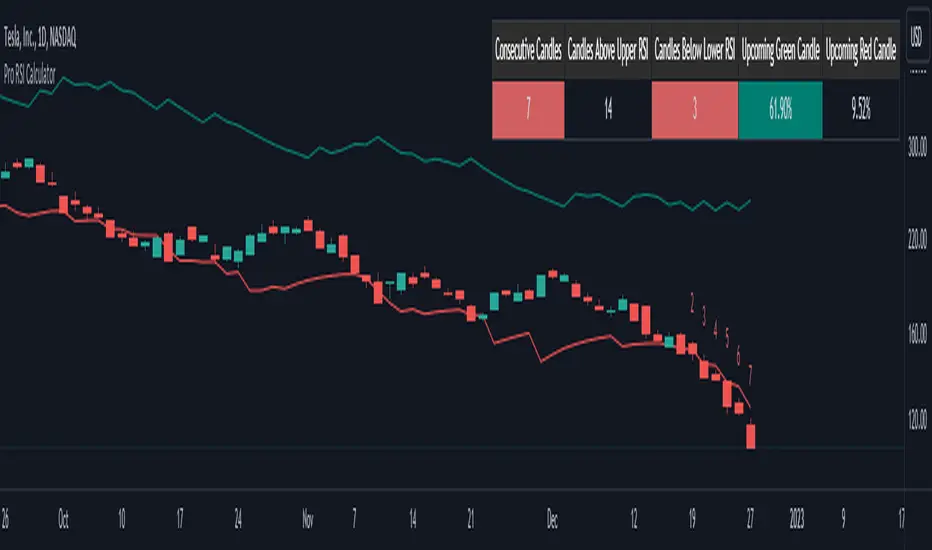
The RSI values obtained from the calculation are skillfully plotted on the price chart, appearing as two distinct lines:
Red Line: Represents the RSI when indicating a bearish trend, anticipating potential price declines.
Teal Line: Represents the RSI in bullish market conditions, signaling the possibility of price increases.
3. Consecutive Candlestick Analysis:
The indicator's core functionality revolves around tracking consecutive candlestick patterns based on their relationship with the RSI lines.
To be included in the analysis, a candlestick must consistently close either above (green candles) or below (red candles) the RSI lines for multiple consecutive periods.
4. Labeling and Enumeration:
To communicate the count of consecutive candles displaying consistent trend behavior, the indicator meticulously assigns labels to the price chart.
Label positioning varies depending on the trend's direction, appearing either below (for bullish patterns) or above (for bearish patterns) the candlesticks.
The color scheme aligns with the candle colors: green labels for bullish candles and red labels for bearish ones.
5. Tabular Data Presentation:
The indicator enhances its graphical analysis with a customizable table that prominently displays comprehensive statistical insights.
Key data points in the table include:
- Consecutive Candles: The count of consecutive candles displaying consistent trend characteristics.
- Candles Above Upper RSI: The number of candles closing above the upper RSI threshold during the consecutive period.
- Candles Below Lower RSI: The number of candles closing below the lower RSI threshold during the consecutive period.
- Upcoming Green Candle: An estimated probability of the next candlestick being bullish, derived from historical data.
- Upcoming Red Candle: An estimated probability of the next candlestick being bearish, also based on historical data.
6. Custom Configuration:
To cater to various trading strategies and preferences, the indicator offers extensive customization options.
Traders can fine-tune parameters like RSI length, upper, and lower bands, label and table placement, and table size to align with their unique trading approaches.
Open-source script
In true TradingView spirit, the author of this script has published it open-source, so traders can understand and verify it. Cheers to the author! You may use it for free, but reuse of this code in publication is governed by House rules. You can favorite it to use it on a chart.
Disclaimer
The information and publications are not meant to be, and do not constitute, financial, investment, trading, or other types of advice or recommendations supplied or endorsed by TradingView. Read more in the Terms of Use.