OPEN-SOURCE SCRIPT
Updated [blackcat] L2 Market Facilitation Index
The Market Facilitation Index (MFI) is a technical indicator that measures the ease with which the market is able to move based on the volume traded. It was developed by Dr. Bill Williams as part of his trading system.
The MFI is calculated by taking into account the difference between the current typical price (average of high, low, and close) and the previous typical price, multiplied by the volume. This difference is then divided by the sum of volume over a specified period.
The MFI helps traders to identify periods of high or low market facilitation. High MFI values indicate that the market is facilitating trade and moving with ease, suggesting increased activity and potential trading opportunities. Conversely, low MFI values suggest a lack of market facilitation, indicating decreased activity and potential consolidation or sideways movement.
Traders can use the MFI in conjunction with other technical indicators and price analysis techniques to make informed trading decisions. It can be used to confirm trends, identify potential reversals, and assess the strength of market movements.
The Market Facilitation Index provides valuable insights into market dynamics, as it focuses on the relationship between price movement and trading volume. By incorporating volume data into its calculations, the MFI captures the impact of volume on market activity.
This indicator is particularly useful in identifying periods of market consolidation or range-bound trading. When the MFI shows low values, it suggests that market participants are hesitant and there may be a lack of clear trends. Traders can interpret this as a potential signal to avoid entering new positions or to tighten their stop-loss levels.
Conversely, when the MFI indicates high values, it signifies that the market is experiencing high levels of activity and price movement. This can be an indication of a strong trend, and traders may look for opportunities to enter positions in line with the prevailing market direction.
In addition to identifying market trends and potential reversals, the MFI can also help traders gauge the strength of price movements. By comparing the MFI values during different price swings or trends, traders can assess whether the market is experiencing increasing or decreasing levels of facilitation. This information can be valuable in determining the overall momentum and sustainability of a trend.
It's important to note that while the Market Facilitation Index can be a useful tool in technical analysis, it should not be used in isolation. Like any indicator, it has its limitations and may not always accurately reflect market conditions. Therefore, it is advisable to combine the MFI with other technical indicators, chart patterns, and fundamental analysis to gain a more comprehensive understanding of the market.
In conclusion, the Market Facilitation Index is a powerful technical indicator that measures the ease with which the market is able to move based on trading volume. It helps traders identify periods of high or low market facilitation, confirm trends, identify potential reversals, and assess the strength of market movements. However, it should be used in conjunction with other analysis methods for comprehensive market evaluation.
Release Notes
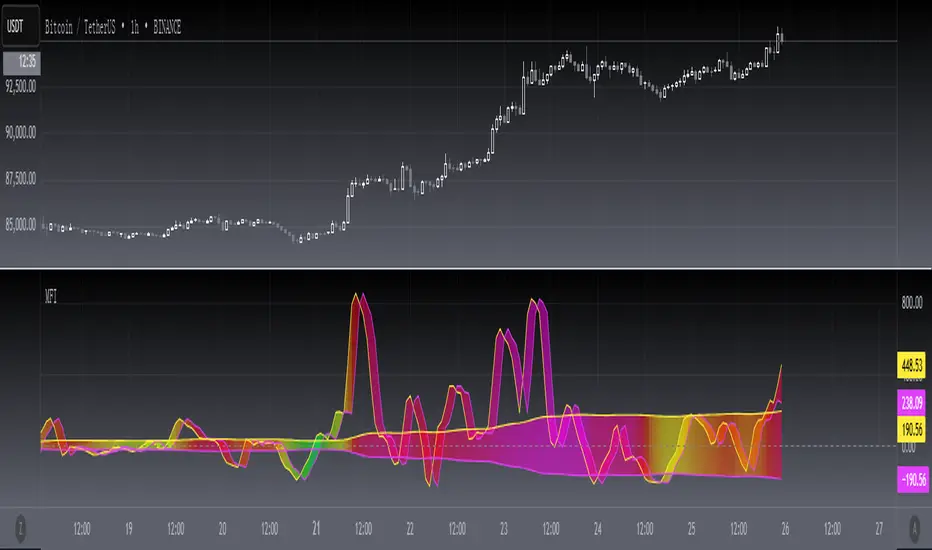
OVERVIEWThe [blackcat] L2 Market Facilitation Index (MFI) indicator is designed to measure the ease of market movement by analyzing price changes and trading volumes. This script calculates a unique MFI value that helps traders identify trends and potential reversals based on market facilitation. With customizable parameters and gradient coloring for better visualization, it provides insights into market dynamics 📊💹.
FEATURES
Calculates Typical Price using high, low, and closing prices.
Computes Volume Difference based on typical price changes and volume.
Determines the Market Facilitation Index (MFI) using an Adaptive Linear Moving Average (ALMA).
Generates a dynamic Color Gradient based on Relative Strength Index (RSI) values:
Colors range from blue to red, indicating different levels of market strength.
Plots the MFI line with gradient fill for enhanced visual representation.
Includes adjustable Upper Bound and Lower Bound lines to define sideways markets.
Provides clear visual cues for trend identification and potential reversal points 🎯
HOW TO USE
Add the indicator to your TradingView chart by selecting it from the indicators list.
Adjust the Sideways Scaler parameter to fine-tune the sensitivity of the bounds.
Observe the plotted MFI line and its gradient colors to assess market conditions.
Use the upper and lower bound lines as references for identifying sideways movements.
Combine this indicator with other tools for confirmation before making trading decisions.
LIMITATIONS
The indicator may generate false signals in highly volatile or ranging markets 🌪️.
Users should test different settings to find optimal parameters for their specific assets and timeframes.
The effectiveness of the indicator may vary across different market conditions.
NOTES
Ensure that you have sufficient historical data available for accurate calculations.
Test the indicator thoroughly on demo accounts before applying it to live trading 🔍.
Experiment with various scalers to achieve the desired balance between responsiveness and stability.
Open-source script
In true TradingView spirit, the creator of this script has made it open-source, so that traders can review and verify its functionality. Kudos to the author! While you can use it for free, remember that republishing the code is subject to our House Rules.
For quick access on a chart, add this script to your favorites — learn more here.
Avoid losing contact!Don't miss out! The first and most important thing to do is to join my Discord chat now! Click here to start your adventure: discord.com/invite/ZTGpQJq 防止失联,请立即行动,加入本猫聊天群: discord.com/invite/ZTGpQJq
Disclaimer
The information and publications are not meant to be, and do not constitute, financial, investment, trading, or other types of advice or recommendations supplied or endorsed by TradingView. Read more in the Terms of Use.