PROTECTED SOURCE SCRIPT
Tracert Trend[s3]
Updated
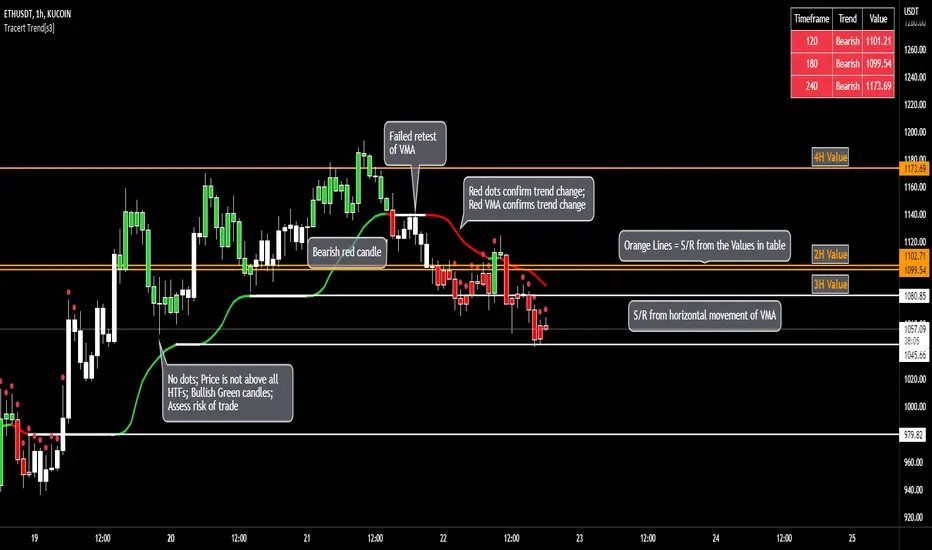
Variable Moving Average(VMA) with a view of the trend based on the VMA on multiple timeframes. The Variable Moving Average (VMA) is a study that uses an Exponential Moving Average being able to automatically adjust its smoothing factor according to the market volatility . The timeframes of the indicator must be set to a higher timeframe than whatever timeframe your chart is set to to work properly. Example(default): Trading on the 15m timeframe so have the timeframes set to: 1) Chart 2) 30m 3) 45m 4) 60m
Green line of VMA = uptrend in price action
Red line of VMA = downtrend in price action
White line of VMA = indecision in price action
Green candles = uptrend and above VMA
Red candles = downtrend and below VMA
White candles = indecision or chop in price action
Green symbol below candle = all six timeframes are above the VMA
Red symbol above candle = all six timeframes are above the VMA
No symbol above or below candle = indecision amongst the six timeframes
Release Notes
- Adjusted default timeframes shown to only 3- Adjusted timeframes to higher timeframes over the 15m timeframe
- Adjusted the table to only show the default 3 timeframes
Release Notes
-Added 1 additional timeframe to default timeframes-Adjusted colors of symbols and table
Release Notes
- Made default timeframes shown to 3Release Notes
- updated default length to 9Release Notes
- changed default Timeframes; defaulted to trade on 1H timeframe- new screen shot of chart to showcase possible strategy
Release Notes
- added alerts for dots (bullish/bearish trend)
- added cloud for other time frames' VMAs
Release Notes
- added color in cloud for neutral
Disclaimer
The information and publications are not meant to be, and do not constitute, financial, investment, trading, or other types of advice or recommendations supplied or endorsed by TradingView. Read more in the Terms of Use.