PROTECTED SOURCE SCRIPT
Visual Range Quarter Points [dasanc]
Introduction
This tool can be used in multiple ways:
Features
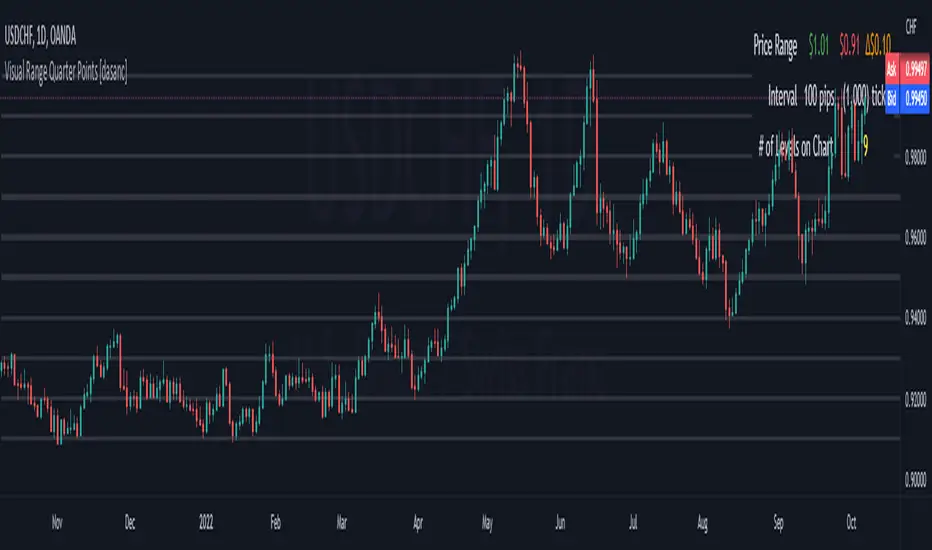
Draw Quarter Point levels on chart based on the visible range. Interval between levels is automatically calculated by default to have ~10 levels on chart.
As you scroll through the chart or change timeframes, the interval and levels are updated.
Change the color, width of levels as a percentage of the interval, and draw additional levels as needed.
Choose to display a dashboard with relevant information on levels:
-Cheers, DasanC
This tool can be used in multiple ways:
- explore a Symbol's historical volatility for DCA and Grid trading strategies.
- combine with Order Blocks as confluence before entering trades
- intra-trade management - partial exits and moving SL into profits
Features
Draw Quarter Point levels on chart based on the visible range. Interval between levels is automatically calculated by default to have ~10 levels on chart.
As you scroll through the chart or change timeframes, the interval and levels are updated.
Change the color, width of levels as a percentage of the interval, and draw additional levels as needed.
Choose to display a dashboard with relevant information on levels:
- Price range - High and Low on visible range
- Interval - display as Currency or PIPs for Forex pairs
- Number of Levels drawn
-Cheers, DasanC
Algo Trading Simplified 👉 PaxProfits.com
Discover the easy way to manage Forex trading accounts. Trusted by traders globally.
Forex Trading Coaching 👉 primetimefox.com
Learn consistent currency pair trading from a professional.
Discover the easy way to manage Forex trading accounts. Trusted by traders globally.
Forex Trading Coaching 👉 primetimefox.com
Learn consistent currency pair trading from a professional.
Disclaimer
The information and publications are not meant to be, and do not constitute, financial, investment, trading, or other types of advice or recommendations supplied or endorsed by TradingView. Read more in the Terms of Use.