PROTECTED SOURCE SCRIPT
iTradeAIMS | The Purple Magic

The Magic Purple Line
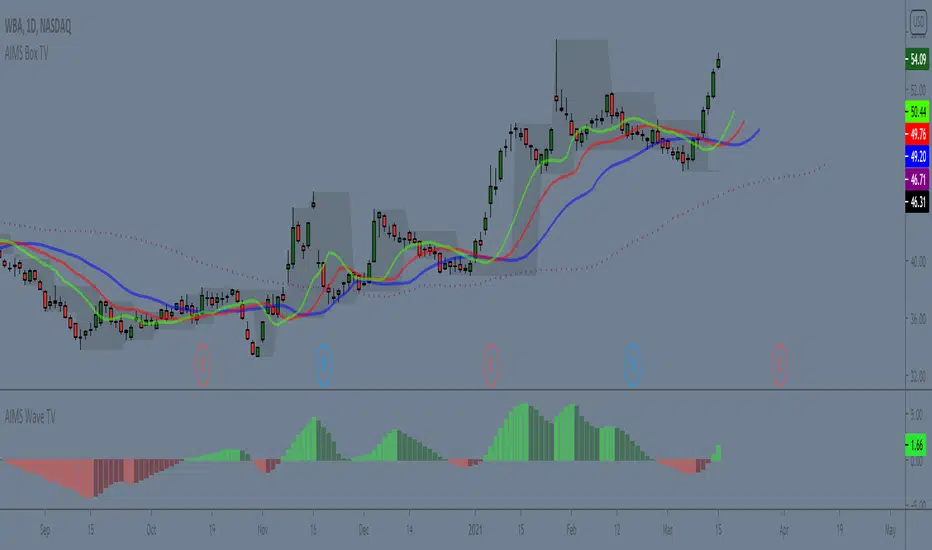
To put it very simply, the Magic Purple Line is the Trend Line that I use for my trading.
It is a Trend line based on Trading Chaos.
Yes, it is the Red Line of the Bill Williams Alligator but...
It is the Red Line of the 5 times higher time frame
This means you will ALWAYS be in tune with the trend of the higher time frame.
that's very simple.
I arrived at this indicator by using some fractal geometric math logic.
The Redline of Bill Williams Alligator Indicator is calculated by using 8-period smooth moving average with a shift of 5 periods to the right.
Multiply 8 by 5 = 40
Multiple 5 by 5 = 25
But to get it Fractal Geometrically correct, I converted it into the Nearest Fib Numbers.
et voila, you have the Magic Purple Line
How to calculate The Magic Purple Line:
Plot a 34 Smooth Moving Average with 21 Shift
I used it like this.
I take entries using AIMS The Box indicator. I want the box to be always above the purple line for my buy orders and vice versa for shorts
E.g. Tesla Entries Marked on this chart.

Note that all entries are marked as Buy Orders because the price is above the purple line.
Hope this helps improve your trading.
If you like it, please hit the LIIKE button and Follow iTradeAIMS 🎈🎉
To put it very simply, the Magic Purple Line is the Trend Line that I use for my trading.
It is a Trend line based on Trading Chaos.
Yes, it is the Red Line of the Bill Williams Alligator but...
It is the Red Line of the 5 times higher time frame
This means you will ALWAYS be in tune with the trend of the higher time frame.
that's very simple.
I arrived at this indicator by using some fractal geometric math logic.
The Redline of Bill Williams Alligator Indicator is calculated by using 8-period smooth moving average with a shift of 5 periods to the right.
Multiply 8 by 5 = 40
Multiple 5 by 5 = 25
But to get it Fractal Geometrically correct, I converted it into the Nearest Fib Numbers.
et voila, you have the Magic Purple Line
How to calculate The Magic Purple Line:
Plot a 34 Smooth Moving Average with 21 Shift
I used it like this.
I take entries using AIMS The Box indicator. I want the box to be always above the purple line for my buy orders and vice versa for shorts
E.g. Tesla Entries Marked on this chart.
Note that all entries are marked as Buy Orders because the price is above the purple line.
Hope this helps improve your trading.
If you like it, please hit the LIIKE button and Follow iTradeAIMS 🎈🎉
Disclaimer
The information and publications are not meant to be, and do not constitute, financial, investment, trading, or other types of advice or recommendations supplied or endorsed by TradingView. Read more in the Terms of Use.