OPEN-SOURCE SCRIPT
Updated Ultimate Volatility Indicator [CC]
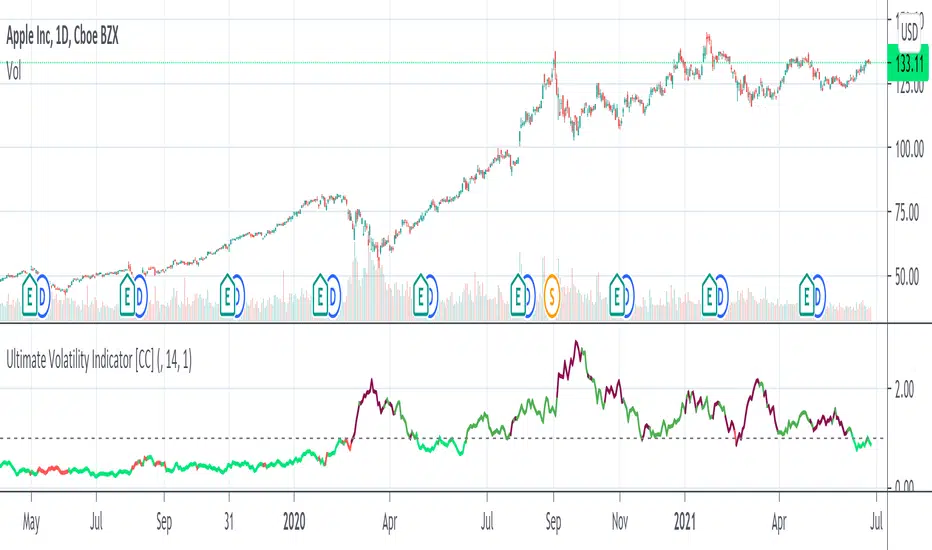
The Ultimate Volatility Indicator was created by Richard Poster (Stocks and Commodities July 2021 pg 21) and this is a very simple but effective indicator. The idea behind volatility indicators is that when the indicator rises above a certain threshold then volatility is high enough and you can make a good amount of money riding the trend in the current direction and then exit when volatility drops below the threshold or until the underlying trend changes.
I have included a threshold that you can change from the default but I would recommend trying out different values to see what works best for you. This indicator will let you know as soon as volatility increases and reacts very quickly. I have included strong buy and sell signals in addition to normal ones so darker colors are strong buy and sell signals and lighter colors are normal signals. Buy when the line turns green and sell when it turns red.
Please let me know if you would like to see me publish any other indicators!
Release Notes
Updated to v5Open-source script
In true TradingView spirit, the creator of this script has made it open-source, so that traders can review and verify its functionality. Kudos to the author! While you can use it for free, remember that republishing the code is subject to our House Rules.
I created the largest stock indicator library:
github.com/ooples/
Custom Indicator Requests:
forms.gle/ouMffZR3dQ8bSJQG7
Tips are appreciated:
paypal.me/cheatcountry
patreon.com/cheatcountry
github.com/ooples/
Custom Indicator Requests:
forms.gle/ouMffZR3dQ8bSJQG7
Tips are appreciated:
paypal.me/cheatcountry
patreon.com/cheatcountry
Disclaimer
The information and publications are not meant to be, and do not constitute, financial, investment, trading, or other types of advice or recommendations supplied or endorsed by TradingView. Read more in the Terms of Use.
Open-source script
In true TradingView spirit, the creator of this script has made it open-source, so that traders can review and verify its functionality. Kudos to the author! While you can use it for free, remember that republishing the code is subject to our House Rules.
I created the largest stock indicator library:
github.com/ooples/
Custom Indicator Requests:
forms.gle/ouMffZR3dQ8bSJQG7
Tips are appreciated:
paypal.me/cheatcountry
patreon.com/cheatcountry
github.com/ooples/
Custom Indicator Requests:
forms.gle/ouMffZR3dQ8bSJQG7
Tips are appreciated:
paypal.me/cheatcountry
patreon.com/cheatcountry
Disclaimer
The information and publications are not meant to be, and do not constitute, financial, investment, trading, or other types of advice or recommendations supplied or endorsed by TradingView. Read more in the Terms of Use.