OPEN-SOURCE SCRIPT
ABCD Projection [Trendoscope®]
Over the years, we have extensively explored and published numerous scripts centered around various chart patterns, including Harmonic Patterns, Reversal Patterns, Elliott Waves, and more. Our expertise in these areas has led to frequent requests for an indicator based on the ABCD pattern. Although we didn't include it as part of our Harmonic Patterns collection, the development of a dedicated ABCD Projection Indicator has always been a priority for us.
🎲 Overview of the ABCD Projection Indicator
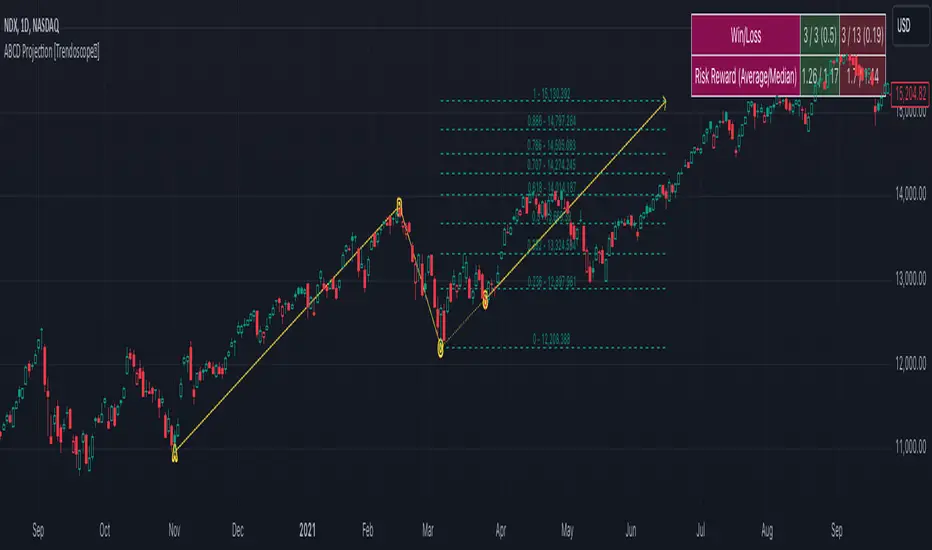
The ABCD Projection Indicator is designed to identify and project ABCD patterns using a Zigzag-based approach. This pattern, characterized by alternating pivot highs and lows labeled as A, B, C, and D, is particularly significant in trending markets where it signifies trend continuation following deep pullbacks.
The indicator works by confirming the ABC pivots and projecting the D pivot based on the established price swings. Since ABCD patterns are most effective in trending environments, the indicator focuses on filtering patterns where the retracement from the C pivot has not compromised the trade's potential. Specifically, it ensures that the starting point (S)—where the pattern is detected—has not retraced beyond a defined threshold, preserving the opportunity to execute a trade with the goal of reaching the projected D pivot.
Additionally, the ABCD Projection Indicator considers the retracement ratio from the C pivot, which plays a crucial role in risk management. A higher retracement ratio reduces the stop distance (from pivot A to the entry point S) while increasing the distance to the target (pivot D), thereby enhancing the reward/risk ratio for trades.
🎲 Components of the ABCD Projection Indicator
The ABCD Projection Indicator comprises several key components:

🎲 Indicator Settings
The settings for the ABCD Projection Indicator are minimal and intuitive, with tooltips provided to guide users through the configuration process.

🎲 Overview of the ABCD Projection Indicator
The ABCD Projection Indicator is designed to identify and project ABCD patterns using a Zigzag-based approach. This pattern, characterized by alternating pivot highs and lows labeled as A, B, C, and D, is particularly significant in trending markets where it signifies trend continuation following deep pullbacks.
The indicator works by confirming the ABC pivots and projecting the D pivot based on the established price swings. Since ABCD patterns are most effective in trending environments, the indicator focuses on filtering patterns where the retracement from the C pivot has not compromised the trade's potential. Specifically, it ensures that the starting point (S)—where the pattern is detected—has not retraced beyond a defined threshold, preserving the opportunity to execute a trade with the goal of reaching the projected D pivot.
Additionally, the ABCD Projection Indicator considers the retracement ratio from the C pivot, which plays a crucial role in risk management. A higher retracement ratio reduces the stop distance (from pivot A to the entry point S) while increasing the distance to the target (pivot D), thereby enhancing the reward/risk ratio for trades.
🎲 Components of the ABCD Projection Indicator
The ABCD Projection Indicator comprises several key components:
- A, B, C Pivots and Zigzag Wave: These elements form the foundational structure of the ABCD pattern.
- S Point: This is the location where the pattern is identified, positioned a few bars away from the confirmed C pivot.
- Estimated D Pivot: The D pivot is projected based on the A, B, and C price levels. The time or distance to the D pivot is influenced by the starting point S.
- Mini Stats Table: Located in the top right corner, this table displays win/loss ratios and risk/reward data for both bullish and bearish scenarios.
- Fibonacci Levels: Calculated from the C to D pivots, these levels are provided as a reference for additional analysis.
🎲 Indicator Settings
The settings for the ABCD Projection Indicator are minimal and intuitive, with tooltips provided to guide users through the configuration process.
Trial - trendoscope.io/trial
Subscribe - trendoscope.io/pricing
Telegram: p.trendoscope.io/telegram
Rate us : trustpilot.com/review/trendoscope.io
Subscribe - trendoscope.io/pricing
Telegram: p.trendoscope.io/telegram
Rate us : trustpilot.com/review/trendoscope.io
Open-source script
In true TradingView spirit, the author of this script has published it open-source, so traders can understand and verify it. Cheers to the author! You may use it for free, but reuse of this code in publication is governed by House rules. You can favorite it to use it on a chart.
Disclaimer
The information and publications are not meant to be, and do not constitute, financial, investment, trading, or other types of advice or recommendations supplied or endorsed by TradingView. Read more in the Terms of Use.