OPEN-SOURCE SCRIPT
RSI/MFI with Volatility Bands [GVD]
Updated
This is an edit of the LAzyBear script.
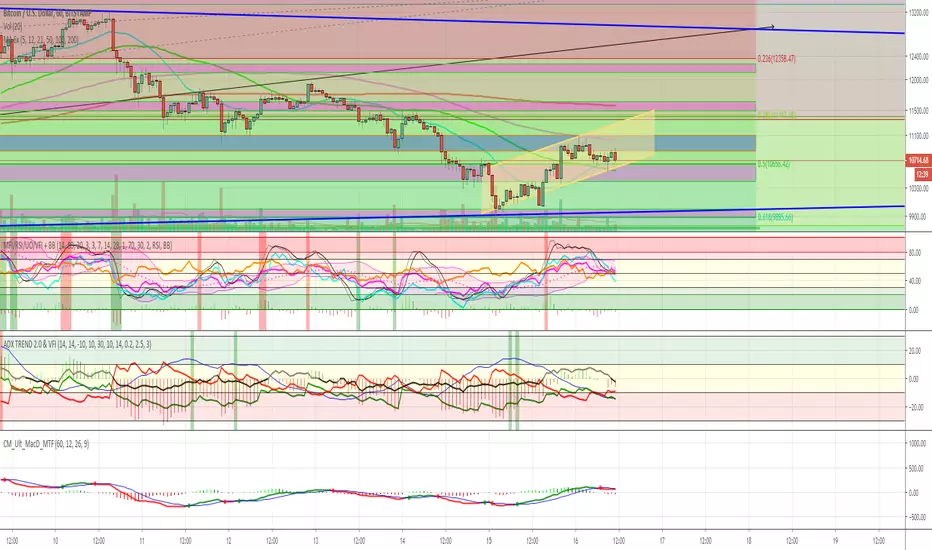
The script is adjusted to show both the RSI and the MFI on 1 chart.
The script is adjusted to show both the RSI and the MFI on 1 chart.
Release Notes
Made it a bit more fancy.Release Notes
Minor updateRelease Notes
minor update (color coding)Release Notes
minor update (color transparency)Release Notes
Additional functionalityYou can now
* plot the MFI, RSI or UO (jointly or seperately)
* choose whether to plot the BB + overbought/oversold indicator on the basis of the MFI, the RSI or the UO
Release Notes
minor bugfixingRelease Notes
minor updateRelease Notes
Added stochastic RSIRelease Notes
User now has the option to select the ultimate overbought / oversold threshold Release Notes
Added additional functionalities. There are now 4 possibilities for highlighting overbought/oversold
Release Notes
minor editRelease Notes
minor updateRelease Notes
reduced the number of overbought/oversold options to 2 (from 4)Release Notes
* added Fast-Slow Stochastic RSI Convergence/Divergence HistogramOpen-source script
In true TradingView spirit, the author of this script has published it open-source, so traders can understand and verify it. Cheers to the author! You may use it for free, but reuse of this code in publication is governed by House rules. You can favorite it to use it on a chart.
Disclaimer
The information and publications are not meant to be, and do not constitute, financial, investment, trading, or other types of advice or recommendations supplied or endorsed by TradingView. Read more in the Terms of Use.