OPEN-SOURCE SCRIPT
RSI Call-outs [BigBitsIO]
Updated
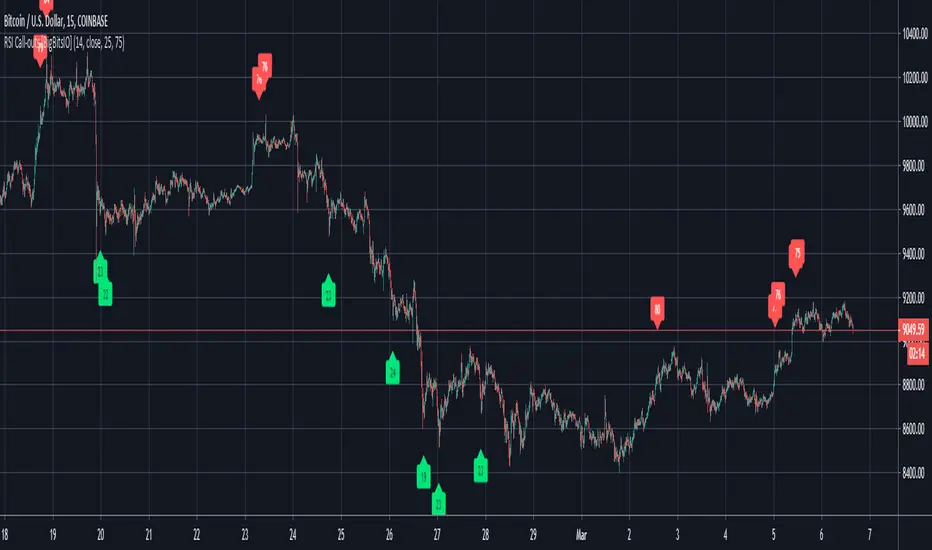
This is a simple RSI indicator that overlays the current chart to show labels for specified oversold and overbought areas defined with inputs.
It will delete any labels of the same kind within the last 3 candles so you don't see as many labels as you would otherwise.
Red labels with white text represent overbought RSI levels as defined by the user.
Green labels with black test represent oversold RSI levels as defined by the user.
This RSI overlay help easily call-out overbought and oversold candles on a chart without sacrificing screen space for a traditional RSI indicator that is not overlayed on the chart.
Release Notes
Added alertconditions so you can use the call-outs to get alerts even though nothing is plotted (other than labels).Be mindful, this indicator can repaint in certain instances since it deletes up to the 3 most recent candle's worth of call-outs.
Like and follow!
💻 Website: bigbits.io
📺 YouTube: youtube.com/bigbits
🎮 Discord: discord.gg/rapMn4z
🐦 Twitter: twitter.com/BigBitsIO
💸 Save $30 on TradingView Paid Plan: bit.ly/2CaRfjs
💻 Website: bigbits.io
📺 YouTube: youtube.com/bigbits
🎮 Discord: discord.gg/rapMn4z
🐦 Twitter: twitter.com/BigBitsIO
💸 Save $30 on TradingView Paid Plan: bit.ly/2CaRfjs
Open-source script
In true TradingView spirit, the author of this script has published it open-source, so traders can understand and verify it. Cheers to the author! You may use it for free, but reuse of this code in publication is governed by House rules. You can favorite it to use it on a chart.
Disclaimer
The information and publications are not meant to be, and do not constitute, financial, investment, trading, or other types of advice or recommendations supplied or endorsed by TradingView. Read more in the Terms of Use.