OPEN-SOURCE SCRIPT
Trend, Momentum, Volume Delta Ratings Emoji Ratings

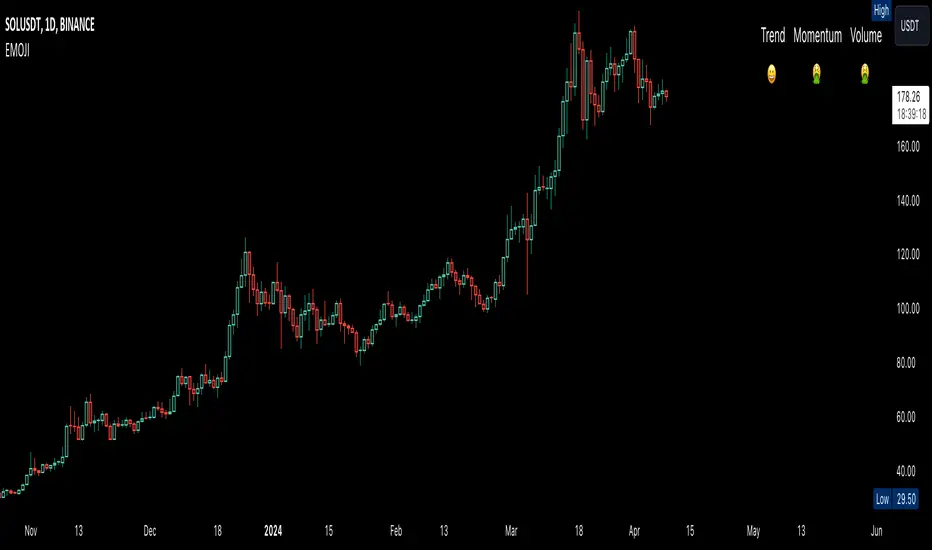
This indicator provides a visual summary of three key market conditions - Trend, Momentum, and Volume Delta - to help traders quickly assess the current state of the market. The goal is to offer a concise, at-a-glance view of these important technical factors.
Trend (HMA): The indicator uses a Hull Moving Average (HMA) to assess the overall trend direction. If the current price is above the HMA, the trend is considered "Good" or bullish (represented by a 😀 emoji). If the price is below the HMA, the trend is "Bad" or bearish (🤮). If the price is equal to the HMA, the trend is considered "Neutral" (😐).
Momentum (ROC): The Rate of Change (ROC) is used to measure the momentum of the market. A positive ROC indicates "Good" or bullish momentum (😀), a negative ROC indicates "Bad" or bearish momentum (🤮), and a zero ROC is considered "Neutral" (😐).
Volume Delta: The indicator calculates the difference between the current trading volume and a simple moving average of the volume (Volume Delta). If the Volume Delta is above a user-defined threshold, it is considered "Good" or bullish (😀). If the Volume Delta is below the negative of the threshold, it is "Bad" or bearish (🤮). Values within the threshold are considered "Neutral" (😐).
The indicator displays these three ratings in a compact table format in the top-right corner of the chart. The table uses color-coding to quickly convey the overall market conditions - green for "Good", red for "Bad", and gray for "Neutral".
This indicator can be useful for traders who want a concise, at-a-glance view of the current market trend, momentum, and volume activity. By combining these three technical factors, traders can get a more well-rounded understanding of the market conditions and potentially identify opportunities or areas of concern more easily.
The user can customize the indicator by adjusting the lengths of the HMA, ROC, and Volume moving average, as well as the Volume Delta threshold. The colors used in the table can also be customized to suit the trader's preferences.
Open-source script
In true TradingView spirit, the author of this script has published it open-source, so traders can understand and verify it. Cheers to the author! You may use it for free, but reuse of this code in publication is governed by House rules. You can favorite it to use it on a chart.
Disclaimer
The information and publications are not meant to be, and do not constitute, financial, investment, trading, or other types of advice or recommendations supplied or endorsed by TradingView. Read more in the Terms of Use.