PROTECTED SOURCE SCRIPT
Volatility - Sacred Geometry
Updated
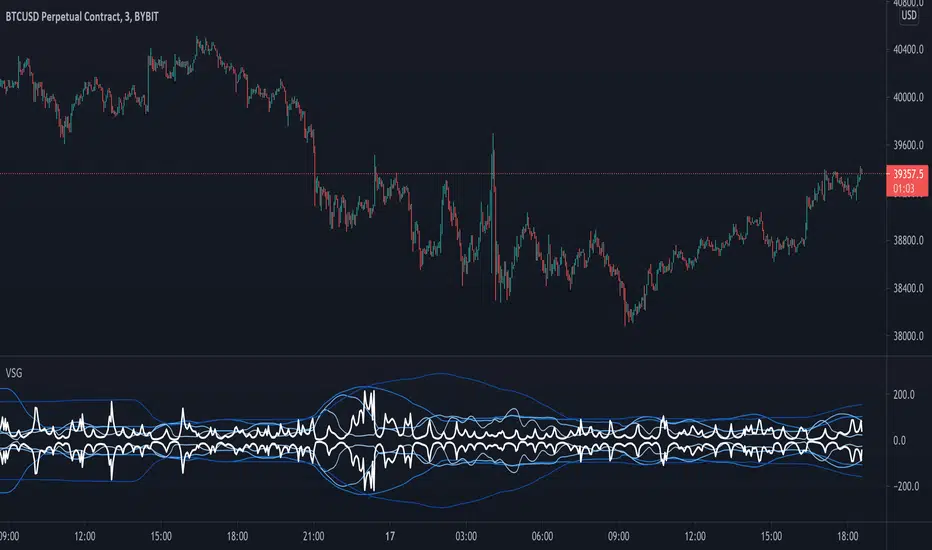
This indicator is designed to pick up changes in volatility before it happens. It also shows current volatility, as price action drops the blue lines contract. The script uses the blue lines to locate spikes in volatility.

Example of dump revealing itself with plenty of notice.

Here large changes in price action are shown when the white lines spike. Traders can get a heads up on any pump or dump a few candles before it happens.

This example shows a low volatility channel vs high volatility channel. The blue lines expand as price range increases.

Trends can be discovered by studying the patterns.
* This indicator does not use sacred geometry, I just called it that because it looks like it. *
If anyone is interested in developing this indicator any further please get in contact.
Example of dump revealing itself with plenty of notice.
Here large changes in price action are shown when the white lines spike. Traders can get a heads up on any pump or dump a few candles before it happens.
This example shows a low volatility channel vs high volatility channel. The blue lines expand as price range increases.
Trends can be discovered by studying the patterns.
* This indicator does not use sacred geometry, I just called it that because it looks like it. *
If anyone is interested in developing this indicator any further please get in contact.
Release Notes
- Updated coloring.- Added Diversions. Can be enabled in settings.
Example of 5 min chart and indicator set to 1 hour chart.
Release Notes
- Added choice of 5 themes.- Added choice of 4 settings presets and custom options.
* This indicator works best with Bitcoin *
Example of Presets (above)
Example of themes.
Example of using indicator with multiple timeframe settings.
Example of using indicator with multiple timeframe settings on lower timeframes.
Disclaimer
The information and publications are not meant to be, and do not constitute, financial, investment, trading, or other types of advice or recommendations supplied or endorsed by TradingView. Read more in the Terms of Use.