OPEN-SOURCE SCRIPT
Yield Curve Inversion

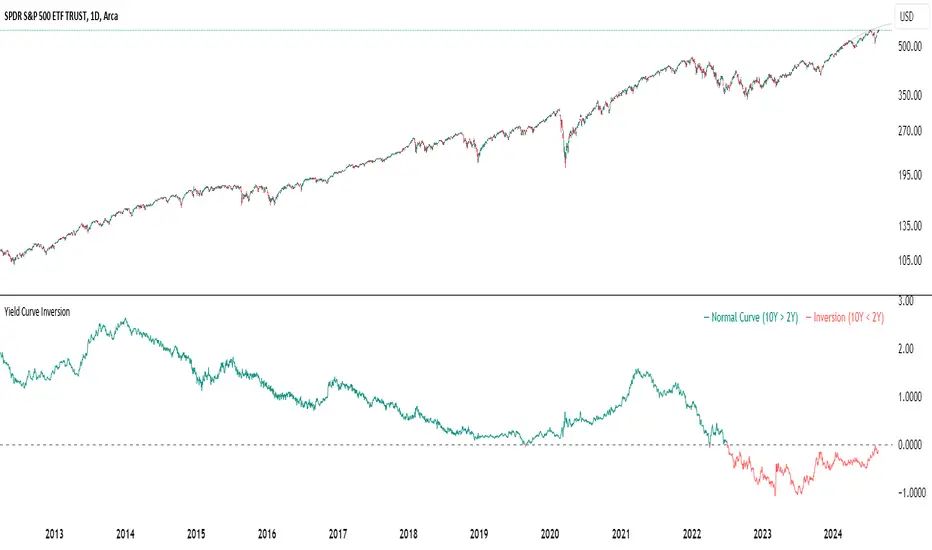
The Yield Curve Inversion indicator is a tool designed to help traders and analysts visualize and interpret the dynamics between the US 10-year and 2-year Treasury yields. This indicator is particularly useful for identifying yield curve inversions, often seen as a precursor to economic recessions.
Features and Interpretations
This indicator is for educational and informational purposes only. It should not be considered financial advice or a recommendation to buy or sell any financial instruments. Users should conduct their own research and consult with a financial advisor before making investment decisions. The creator of this indicator is not responsible for any financial losses incurred through its use.
Features and Interpretations
- Display Modes: Choose between "Spread Mode" to visualize the yield spread indicating normal (green) or inverted (red) curves, or "Both Yields Mode" to view both yields.
- Yield Spread: A plotted difference between 10-year and 2-year yields, with a zero line marking inversion. A negative spread suggests potential economic downturns.
- Color Coding: Green for a normal yield curve (10Y > 2Y) and red for an inverted curve (2Y > 10Y).
- Legend: Provides quick reference to yield curve states for easier interpretation.
This indicator is for educational and informational purposes only. It should not be considered financial advice or a recommendation to buy or sell any financial instruments. Users should conduct their own research and consult with a financial advisor before making investment decisions. The creator of this indicator is not responsible for any financial losses incurred through its use.
Open-source script
In true TradingView spirit, the author of this script has published it open-source, so traders can understand and verify it. Cheers to the author! You may use it for free, but reuse of this code in publication is governed by House rules. You can favorite it to use it on a chart.
Disclaimer
The information and publications are not meant to be, and do not constitute, financial, investment, trading, or other types of advice or recommendations supplied or endorsed by TradingView. Read more in the Terms of Use.