OPEN-SOURCE SCRIPT
Updated Bitcoin Rainbow Wave
Bitcoin ultimate price model:
1. Power Law + 2. Rainbow Narrowing Bands + 3. Halving Cycle Harmonic Wave + 3. Wave bands
This powerful tool is designed to help traders of all levels understand and navigate the Bitcoin market. It works exclusively with BTC on any timeframe, but looks best on weekly or daily charts. The indicator provides valuable insights into historical price behavior and offers forecasts for the next decade, making it essential for both mid-term and long-term strategies.
How the Model Works
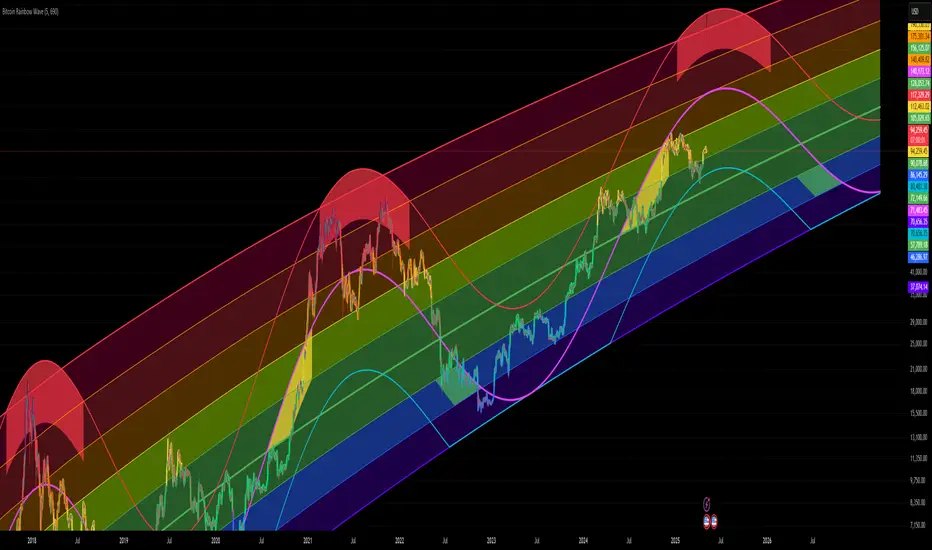
Power Law (Logarithmic Trend): The green line represents the expected long-term price trajectory of Bitcoin based on a logarithmic regression model (power law). This suggests that Bitcoin's price generally increases as a power of 5.44 over time passed.
Rainbow Chart: Colored bands around the power law trend line illustrate a range of potential price fluctuations. The bands narrow esponentially over time, indicating increasing model accuracy as Bitcoin matures. This chart visually identifies overbought and oversold zones, as well as fair value zones.
Blue Zone: Below the power law trend, indicating an undervalued condition and a potential buying zone.
Green Zone: Around the power law trend, suggesting fair value.
Yellow Zone: Above the power law trend, but within the rainbow bands. Exercise caution, as the price may be overextended.
Red Zone: Far above the power law trend, indicating strong overbought conditions. Consider taking profits or reducing exposure.
Halving Cycle Wave: The fuchsia line represents the cyclical wave component of the model, tied to Bitcoin's halving events (approximately every four years). This wave accounts for the price fluctuations that typically occur around halvings, with price tending to increase leading up to a halving and correct afterwards. The amplitude of the wave decreases over time as the impact of halvings potentially lessens. Additional bands around the wave show the expected range of price fluctuations, aiding traders in making informed decisions.
Customizing Parameters
You can fine-tune the model's appearance by adjusting these input parameters:
show Power Law (true/false): Toggle visibility of the power law trend line.
show Wave (true/false): Toggle visibility of the halving cycle wave.
show Rainbow Chart (true/false): Toggle visibility of the rainbow bands.
show Block Marks (true/false): Toggle visibility of the 70,000 block interval markers.
Using the Model in Your Trading Strategy
Combine this indicator with technical analysis, fundamental analysis, and risk management techniques to develop a comprehensive Bitcoin trading strategy. The model can help you identify potential entry and exit points, assess market sentiment, and manage risk based on Bitcoin's position relative to the power law trend, halving cycle wave, and rainbow chart zones.
1. Power Law + 2. Rainbow Narrowing Bands + 3. Halving Cycle Harmonic Wave + 3. Wave bands
This powerful tool is designed to help traders of all levels understand and navigate the Bitcoin market. It works exclusively with BTC on any timeframe, but looks best on weekly or daily charts. The indicator provides valuable insights into historical price behavior and offers forecasts for the next decade, making it essential for both mid-term and long-term strategies.
How the Model Works
Power Law (Logarithmic Trend): The green line represents the expected long-term price trajectory of Bitcoin based on a logarithmic regression model (power law). This suggests that Bitcoin's price generally increases as a power of 5.44 over time passed.
Rainbow Chart: Colored bands around the power law trend line illustrate a range of potential price fluctuations. The bands narrow esponentially over time, indicating increasing model accuracy as Bitcoin matures. This chart visually identifies overbought and oversold zones, as well as fair value zones.
Blue Zone: Below the power law trend, indicating an undervalued condition and a potential buying zone.
Green Zone: Around the power law trend, suggesting fair value.
Yellow Zone: Above the power law trend, but within the rainbow bands. Exercise caution, as the price may be overextended.
Red Zone: Far above the power law trend, indicating strong overbought conditions. Consider taking profits or reducing exposure.
Halving Cycle Wave: The fuchsia line represents the cyclical wave component of the model, tied to Bitcoin's halving events (approximately every four years). This wave accounts for the price fluctuations that typically occur around halvings, with price tending to increase leading up to a halving and correct afterwards. The amplitude of the wave decreases over time as the impact of halvings potentially lessens. Additional bands around the wave show the expected range of price fluctuations, aiding traders in making informed decisions.
Customizing Parameters
You can fine-tune the model's appearance by adjusting these input parameters:
show Power Law (true/false): Toggle visibility of the power law trend line.
show Wave (true/false): Toggle visibility of the halving cycle wave.
show Rainbow Chart (true/false): Toggle visibility of the rainbow bands.
show Block Marks (true/false): Toggle visibility of the 70,000 block interval markers.
Using the Model in Your Trading Strategy
Combine this indicator with technical analysis, fundamental analysis, and risk management techniques to develop a comprehensive Bitcoin trading strategy. The model can help you identify potential entry and exit points, assess market sentiment, and manage risk based on Bitcoin's position relative to the power law trend, halving cycle wave, and rainbow chart zones.
Release Notes
The updated version of the indicator now includes predicted buy zones at the bottom and sell zones at the peak of the Bitcoin halving cycle. It is now possible to forecast the timing and levels of peaks and bottoms, as well as predict bull and bear markets.The display of these zones can be enabled or disabled in the indicator settings.
The appearance has been improved.
Release Notes
Enhancements to the Bitcoin Rainbow Wave IndicatorThis enhanced version of the Bitcoin Rainbow Wave indicator now incorporates both buy and sell zones, providing additional insights for potential trading decisions.
Buy Zones:
Past: Six distinct buy zones are identified in the historical price data. These zones are visually represented by green shaded areas between the lower wave band (wave_low_cut) and a calculated straight line based on its intersections with the first and the third rainbow level lines.
Future: Three projected buy zones are added to the chart, extending into the future projection.
Sell Zones:
Past: Four sell zones are identified in the past, indicated by red shaded areas between the upper wave band (wave_up) and a calculated straight line derived from its intersections with the seventh and eighth rainbow level lines.
Future: Three projected sell zones are included in the future projection, also shaded in red.
Interpretation:
Buy Zones: These zones suggest periods where Bitcoin might be considered undervalued or oversold, potentially offering buying opportunities and the beginning of the bull market.
Sell Zones: These zones indicate periods where Bitcoin might be considered overvalued or overbought, potentially signaling selling opportunities and the beginning of the bear market.
Important Considerations:
The Bitcoin Rainbow Wave, including the buy and sell zones, is a model based on historical price patterns and should not be the sole basis for investment decisions.
Always conduct thorough research and consider multiple factors before makingany trading or investment choices.
These zones are projections and may not accurately predict future price movements.
Release Notes
Even spaces between the lines in the rainbow chart. The total rainbow width was reduced by 1% and the wave bands width was reduced by 4%. Better explanation of the bitcoin time calculations in the code.
Release Notes
Every line in this chart has its straightforward analytical formula. All functions are dependent only on just one variable - h.
h - is basically a block number but normalized by dividing by 210 000.
This is to make it increase by 1 each halving cycle.
Release Notes
Thorrowly updated the script.One new feature added - The Fair Value Model.
To see it - go into the inticator options and
select just the folowing 3 options:
Show wave
Show wave line
Show fair value
and deselect all other options.
Then play around other options at your will.
Release Notes
1) Added half the halving marks2) Updated the average block time after halving 4.
Release Notes
This is the updated entire Rainbow Wave model which contains 5 models inside:1.Power Law model
log(BTC) = 1.5 + 5.4 * log(h)
2.Rainbow chart model
log(price) = 1.5 + 5.4 * log(h) + k/3 * 0.8^(h+1), where k belongs to {-3, -2, -1, 0, 1, 2, 3, 4, 5}
3.Damped Harmonic oscillation model including 4.Diminishing Ignorance delay (lag) model
log(price) = 1.5 + 5.4 * log(h) + s i n (2pi*h - h^-1.4) * 0.8^(h+1)
5.Rainbow bands model +- 2/3 * 0.8^(h+1)
In the settings section you can turn on and off any part of model at your liking.
The changes implemented to the model and the code:
1) Finetuned the model to a more simplified form (I like less digits):
log(BTC) = 1.5 + 5.4 * log(h)
2) h is now in percentages and it represents the progress from halving to halving. 1 halving or 210000 blocks represents 100%.
3) Minor marks now represent 25% of the halving period (approximately 1 astronomical year).
4) There is now option to turn off the visibility of the minor block marks.
As usual - these models work just for bitcoin price. There is an issue in drawing the future lines. Most likely - the limitations on the amount of calculatioins allowed by TV.
So, it works better for weekly timeframe.
Release Notes
Corrected some visibility issues and cleared the code.Release Notes
Fully rewritten code.Rainbow wave is now visible.
There are options to turn on or off
1. The rainbow chart elements (Power Law, bands, fair value, rainbow)
2. The rainbow wave elements (The wave, bands, fair value, rainbow)
3. Additional elements (Halvings, 25% of halvings, buy-sell zones)
Release Notes
This addition adds the marks for the tops of the cycles.There are two marks for each top:
1. The maximum deviation from the power law at a point of intersection of the upper wave band and the upper rainbow band. This happens sooner.
2. The absolute maximum of the fair value rainbow wave zone. This happens later.
These two points are the two reference points for estimating the timing and the value of the future tops.
At the signs the days since the Genesis Block in days and the price value in USD are given for convinience.
All options can be turned on or off - check the settings.
Release Notes
Finetuned the tops information and visibility.By default now most of the options are switched off for clearer chart.
Feel free to turn the necessary options at your liking.
Release Notes
Overall EnhancementThe new labeling system provides a richer historical context for price action analysis. It now combines four dimensions:
Percentage of Halvings: This places the mark in relation to the Bitcoin halving cycle, a key driver of scarcity and price.
Exact Calendar Date: This anchors the mark in real-world time for precise historical reference.
Days Since Genesis Block: This provides an absolute measure of Bitcoin's age at that point.
Price in $$ (for two tops in each cycle): This directly links the mark to significant price peaks for understanding market cycles.
Label Breakdown
Let's take a closer look at the structure of the new labels:
h=25% 22/4/10 t=473:
h=25%: This mark represents a point 25% of the way through a halving cycle.
22/4/10: The exact date associated with this mark.
t=473: The number of days that had passed since the Bitcoin Genesis Block at this point.
h=328% 26/6/21 t=4557 $84.5k:
h=328%: This mark is significantly further into a halving cycle, 328% to be precise, indicating a later stage in the cycle.
26/6/21: The exact date.
t=4557: Days since Genesis.
$84.5k: This adds the price dimension, showing that one of the two price tops in this cycle reached $84,500.
Advantages for Studying Bitcoin History
This multi-faceted labeling system equips traders and analysts with powerful tools:
Cycle Awareness: The percentage of halvings metric allows for easy identification of where a mark falls within a cycle, aiding in pattern recognition and cycle-based trading strategies.
Precise Timing: Exact dates enable correlation with other historical events or market indicators.
Long-term Perspective: Days since Genesis provides a sense of Bitcoin's maturity at each point.
Price Context: The inclusion of price peaks for each cycle helps gauge market sentiment and potential overvaluation or undervaluation.
Overall, this labeling system significantly enhances the historical insight provided by the Bitcoin Rainbow Wave indicator, enabling more nuanced and informed analysis of Bitcoin's price action over time.
Release Notes
Updated the logics of showing the wave lines cut or uncut.Release Notes
Clarifying the code and commenting.Release Notes
This is a major update of the model.This update introduces a more sofisticated learning time function:
(cos(2.54h+0.16)+1.13)(7e^{-1.27h}+0.22)
This function have replaced the previous h^-1.4 function.
The waves now fully match the tops and bottoms of the 6 previous bitcoin cycles.
Release Notes
Just finetuning the Power Law from 1.45+h^5.5 to 1.455+h^5.5Release Notes
October 17, 2024 update.Increased the intersept parameter from 1.45 to 1.455 - this shifts the chart up by 1%.
Better fit to the 2024 price action.
Release Notes
In the updated version the buy and sell zones are substituted by 3 types of the No Miss Zones.Green - at the end of the bear market
Yellow - in the middle of the bull market
Red - near the top of the bull market
Bitcoin alway visits all these 3 zones.
It already happened
4 times for the red zones
5 times for the yellow zones
6 times for the green zones
Parameters are updated as well.
a = 1.5
b = 5.4
decay = math.pow(0.79, h + 0.9)
Release Notes
Added the forth "No miss" zoneCurrently
Green-Yellow-Red-Orange-Green-Yellow....
Release Notes
Fixing some issues with indicator names.Release Notes
No fitting after 2020. Just a fixed phase shift of 0.03Release Notes
Just have returned the bands to its normal position after some scientific battle with PlanG on X.Sorry if somebody noticed small shifts diring last week - I was also under huge stress fighting to protect this model.
Release Notes
Current update to match the future lines with the past with less overlapping.Release Notes
Corrected overlapping past and future issue. Added only lines option to the rainbow chart.
Release Notes
The number of future bars is now a userdefined variable.The default value is 690 future bars, which is good for weekly and daily timeframes. Users can input the # numbers manually for different timeframes.
The recommended values for different timeframes:
Timeframe | Recommended # of future bars
1H-4H | < 4500
D | < 3300
W | < 690
2W | < 350
M | < 180
2M-3M | < 60
Release Notes
Missprint of a date of topRelease Notes
No there are 5 distinct "no-miss" zones.Blue - the bottom of the cycle, end of bear market.
Green - the start of the bull run.
Yellow - the mid point of the bull run.
Red - the top of the cycle - turning point of the bull run.
Orange - the mid point of the bear market.
Release Notes
Upgraded to the latest Pine V6 for better performance.Release Notes
The power law intercept parameter had been decreased from 1.5 to 1.48.This change is due to the recent bitcoin drop down to $78k.
As a result all the lines moved down by 5% in nominal prices.
Release Notes
Default view is now Full Rainbow wave and hidden "no-miss" zones.Release Notes
1) The Red "no-miss" zone was extended to the right thus reducing the orange zone.2) Intercept now = 1.475
Release Notes
The red zone was extended.Now it captures two of the previous cycle tops and gives more room for the current cycle top to reach this zone.
Release Notes
Major Update 25.03.2025Wave width increase from 4 units to 5 units.
Parameter change.
a = 1.45 // Parameter 1 - Intercept (a)
b = 5.43 // Parameter 2 - Slope (b)
decay = math.pow(0.8, h + 1) // Parameter 3 - the exponential decay factor
Release Notes
Updated some label colors for better visibility.Updated the current block date.
Release Notes
Slope change from 5.43 to 5.42Release Notes
Intercept change from 1.45 to 1.448Release Notes
Intercept change from 1.48 to 1.47Release Notes
Parameters adjustmentIntercept 1.45
Slope 5.4
Release Notes
a = 1.46 b = 5.38
The yellow and the green zone united into the yellow zone.
The Blue zone became the green zone.
30 lines of code cleared.
Release Notes
Error correction for future yellow zone.Release Notes
Red no-miss zone updated for better visual presentation.Release Notes
Red zone improvementsRelease Notes
h clock updated. Earlier times corrected.Release Notes
Dates are updated as 1/4 of the cycle passed since halving #4.Release Notes
Fair value zone extended to 4 stripes.Colours improoved.
Release Notes
Major update April 2025.1. Complete code optimization for faster performance.
2. New vertical fibonacci "time marks are added" for 0.382 and 0.618 past each halving
3. The time marks became coloured.
4. Top of the cycles marks removed.
4. Minor parameter adjustments:
The width became tighter (from 0.8 decay factor to 0.79)
The Power law intercept from 1.46 to 1.47
Release Notes
Fixed the y coordinates of the time marks.Release Notes
25%-50%-75% marks are dashedHalvings and 0.382 and 0.612 marks are solid
Release Notes
Major visual update.Colorful price line added.
Code optimization.
Extensive commenting.
No parameter change.
Release Notes
Green zone visualization corrected.Release Notes
Improved time to h convertion. Now each 25% of halving points of correction.
Release Notes
Green no-miss zones did not draw without rainbow lines. CorrectedRelease Notes
Line colors became editable againRelease Notes
Colored price line is also editableOpen-source script
In true TradingView spirit, the creator of this script has made it open-source, so that traders can review and verify its functionality. Kudos to the author! While you can use it for free, remember that republishing the code is subject to our House Rules.
Disclaimer
The information and publications are not meant to be, and do not constitute, financial, investment, trading, or other types of advice or recommendations supplied or endorsed by TradingView. Read more in the Terms of Use.
Open-source script
In true TradingView spirit, the creator of this script has made it open-source, so that traders can review and verify its functionality. Kudos to the author! While you can use it for free, remember that republishing the code is subject to our House Rules.
Disclaimer
The information and publications are not meant to be, and do not constitute, financial, investment, trading, or other types of advice or recommendations supplied or endorsed by TradingView. Read more in the Terms of Use.