OPEN-SOURCE SCRIPT
Buyer to Seller Volume (BSV) Indicator
As promised, here is the buyer to seller volume indicator!
About it/How it works:
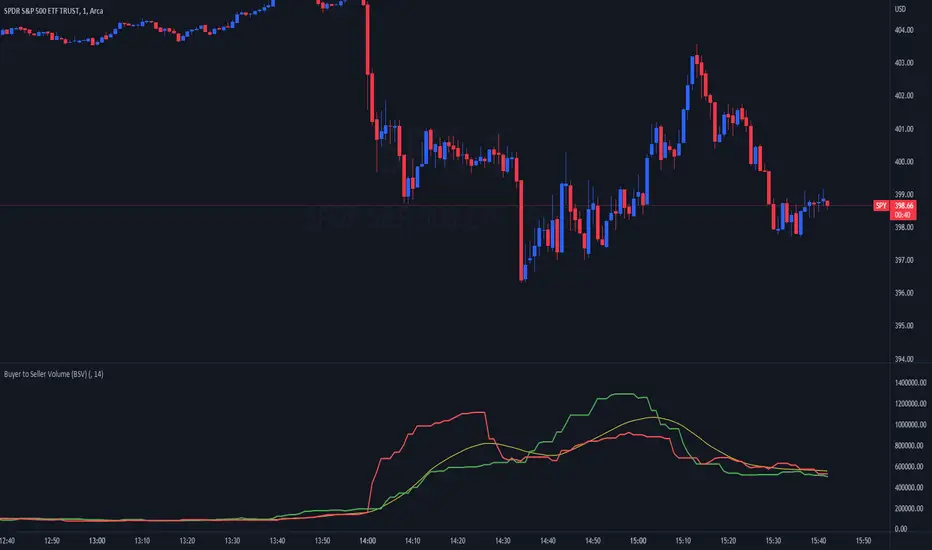
The indicator tracks buying and selling volume. It does it simplistically but effectively simply by looking at red vs green candles and averaging out the volume of each respective candle.
It uses the SMA of buying/selling and overall volume to track buyers to sellers and also display the average volume traded over a designated period of time.
Legend:
Green lines = buying volume
Red lines = selling volume
Yellow lines = SMA over designated period of time (user input defined, default is 14 candles).
Buyers are shown in green and sellers are shown in red:

How to Use it:
Default, the indicator goes to 1 Day, 14 candle period.
My preference personally is to use to have it go to "chart" but you can view any time period on the chart that you want and designate the time period of volume you want to view independently.
This can be used for:
1. Identify trends: When buying or selling volume is above selling volume and above the SMA, you know that this persuasively supports a bullish trend. Inverse for the opposite (see below):


2. To identify fakeouts and whether there is volume backing a move:

3. To identify potential changes in trends via a cross:

Its also a great reference when you are unsure of a move. This indicator literally just saved me from wrongfully shorting the FOMC bear flag today:

Probably many other uses you can find, but these are the things I like to use it for!
As always, I have posted a tutorial video for your reference:

As always though, if you have any questions, comments or suggestions for the indicator, please share them below!
Safe trades and best of luck to all!
About it/How it works:
The indicator tracks buying and selling volume. It does it simplistically but effectively simply by looking at red vs green candles and averaging out the volume of each respective candle.
It uses the SMA of buying/selling and overall volume to track buyers to sellers and also display the average volume traded over a designated period of time.
Legend:
Green lines = buying volume
Red lines = selling volume
Yellow lines = SMA over designated period of time (user input defined, default is 14 candles).
Buyers are shown in green and sellers are shown in red:
How to Use it:
Default, the indicator goes to 1 Day, 14 candle period.
My preference personally is to use to have it go to "chart" but you can view any time period on the chart that you want and designate the time period of volume you want to view independently.
This can be used for:
1. Identify trends: When buying or selling volume is above selling volume and above the SMA, you know that this persuasively supports a bullish trend. Inverse for the opposite (see below):
2. To identify fakeouts and whether there is volume backing a move:
3. To identify potential changes in trends via a cross:
Its also a great reference when you are unsure of a move. This indicator literally just saved me from wrongfully shorting the FOMC bear flag today:
Probably many other uses you can find, but these are the things I like to use it for!
As always, I have posted a tutorial video for your reference:
As always though, if you have any questions, comments or suggestions for the indicator, please share them below!
Safe trades and best of luck to all!
Premium indicators and content have launched! Get access at: patreon.com/steversteves
Open-source script
In true TradingView spirit, the author of this script has published it open-source, so traders can understand and verify it. Cheers to the author! You may use it for free, but reuse of this code in publication is governed by House rules. You can favorite it to use it on a chart.
Disclaimer
The information and publications are not meant to be, and do not constitute, financial, investment, trading, or other types of advice or recommendations supplied or endorsed by TradingView. Read more in the Terms of Use.