PROTECTED SOURCE SCRIPT
All Indicators in one ( RSI - SMA - STOCH - MACD - ADX - MFI )
Updated

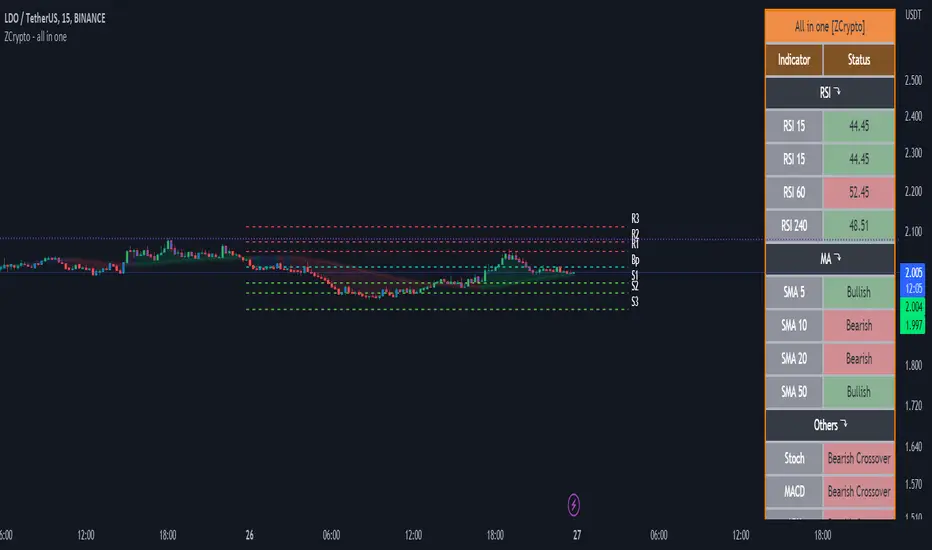
This Indicator will improve your Chart reading as it display most of the common used Indicators in a table with colored Background changes depend on the status of the indicator .
What indicators does this script have ?
all of the above indicators will show in a table , table cell will change in color ( green or red ) depend on the status of the indicators
Green and red table status :
For the RSI
If RSI is above RSI MA = Green which indicate - up trend
if not then its RED which indicate down trend
-----------
For SMA
if Price above SMA = Green which indicate - up trend
if not then its RED which indicate down trend
also SMA 50 when price is above it , it changes its color to green
if price is under SMA 50 , it will be red
-----------------------
For Stochastic :
if K > D and ks < 90 = Green which indicate - up trend
if not then its RED which indicate down trend
-----------------------
For MACD
if MACD is above signal and MACD is bigger than 0.000 = Green which indicate - up trend
if not then its RED which indicate down trend
-----------------------
For ADX
if ADX> 20 and plus > minus = Green which indicate - up trend
if not then its RED which indicate down trend
-----------------------
For MFi
if MFi > 75 = Overboughtwhich indicate - a dump could happen
if MFi < 20= Oversoldwhich indicate - a pump could happen
if MFI < 50 and > 20 = Bearish Rangewhich indicate - price is going down
if MFI > 50 and < 75 = Bullish Rangewhich indicate - price is going UP
also added a feature
whenever the price cross the 50 SMA
it will show you the lowest price from the 10 Previous candles , could be used as a stoploss
**
All settings can be adjusted to your needs
What indicators does this script have ?
- RSI Multi timeframes (Chart RSI - 15m - 1h - 4h )
- SMA ( 5 - 10 - 20 - 50 )
- Stochastic
- MACD
- ADX
- MFI
all of the above indicators will show in a table , table cell will change in color ( green or red ) depend on the status of the indicators
Green and red table status :
For the RSI
If RSI is above RSI MA = Green which indicate - up trend
if not then its RED which indicate down trend
-----------
For SMA
if Price above SMA = Green which indicate - up trend
if not then its RED which indicate down trend
also SMA 50 when price is above it , it changes its color to green
if price is under SMA 50 , it will be red
-----------------------
For Stochastic :
if K > D and ks < 90 = Green which indicate - up trend
if not then its RED which indicate down trend
-----------------------
For MACD
if MACD is above signal and MACD is bigger than 0.000 = Green which indicate - up trend
if not then its RED which indicate down trend
-----------------------
For ADX
if ADX> 20 and plus > minus = Green which indicate - up trend
if not then its RED which indicate down trend
-----------------------
For MFi
if MFi > 75 = Overboughtwhich indicate - a dump could happen
if MFi < 20= Oversoldwhich indicate - a pump could happen
if MFI < 50 and > 20 = Bearish Rangewhich indicate - price is going down
if MFI > 50 and < 75 = Bullish Rangewhich indicate - price is going UP
also added a feature
whenever the price cross the 50 SMA
it will show you the lowest price from the 10 Previous candles , could be used as a stoploss
**
All settings can be adjusted to your needs
Release Notes
Added Vwap Added BTC Filter
Added DXY Filter
+ minor changes .
Release Notes
Added Market prediction method . it will be ahead of incoming dump/pump ..
Trade Safely .
Release Notes
New simple update gives the ability to choose the type of MA you can choose between
- SMA
- EMA
- WMA
- VWMA
Release Notes
Added Alerts for possible Market/PUMP or DUMP Use with caution this is a market prediction not 100% event .
Release Notes
Added ( last Week - last day ) pivot levels with lines and labels also added Psychological levels
Release Notes
Minor changesRelease Notes
Added STC indicator made some polish the table a bit
made a dynamic text for RSI + MA
modified the colors a bit
Release Notes
Minor fixesRelease Notes
Minor fixes2Release Notes
Added Support and resistance Release Notes
Added Show lines for sup and res refined the settings UX
Release Notes
removed Stoploss line .Release Notes
Added the ability to change colors for - Lines
- EMA Trend
Release Notes
Added the ability to change lines text color Release Notes
adjusted coloring code + made labels smallers Release Notes
Added Table position changer, text size changer Added Stoch RSI condition
Disclaimer
The information and publications are not meant to be, and do not constitute, financial, investment, trading, or other types of advice or recommendations supplied or endorsed by TradingView. Read more in the Terms of Use.