Pivot and Price Discovery
Updated

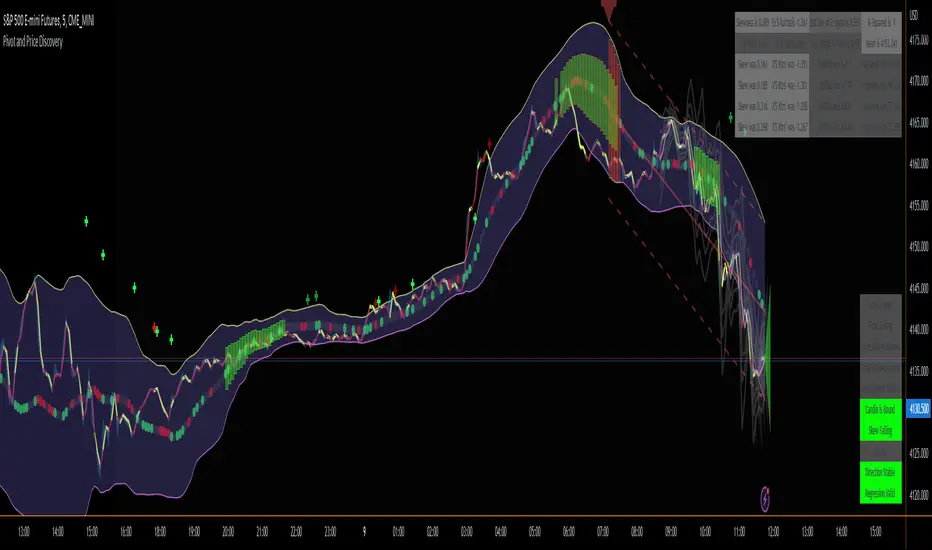
A Population Sampled linear regression model that provides additional detail about the distribution moments (skew, kurtosis, variance and mean) as well as providing indicators that track when a pivot has enough momentum to trade on as well as expected ranges of future price action based on Std Devs.
For the momentum lines -- red indicates that there has been a reducing pivot with momentum, this continues as a grey line for continuation, and will be cancelled when an increasing pivot with momentum is encountered.
Forward looking trend triangle captures the +/- stated standard deviation from the latest bar_index over 2 periods. Movements that trace outside of this can be considered a precursor to an upcoming pivot, and by analyzing skewness and kurtosis, the probability of an upcoming pivot should be better understood.
I have really only looked at this for timescales greater than 5 minutes. Adjust the lookback length accordingly when moving to different timescales:
For example, 1 hr at 10m timescale will be a lookback length of 6 which is too low for accurate analysis, so keep the lookback length appropriate for the timescales being used.
Also realize that trade volume will skew the deviations and regression if you are including data outside of regular trading hours (futures are different, but also experience volume sensitivity -- I maylook into accounting for this in future versions.)
© TheGeeBee
Release Notes
Minor changes -- added adjustable bkground color, added indicators when kurtosis is outside the critical values.Release Notes
Updated graph to include historical periods where skew and excess kurtosis are past the critical values : Long boxes are kurtosis and short boxes are skew. The box outline indicates if the value was positive (green) or negative (red), the box color itself is not indicative of anything other than to allow the skew and kurtosis boxes to be visible when both are above the cv.Refined the momentum directionality indicator dots to more accurately capture pivots that are probability driven, rather than just momentum driven.
Added historical values to the Moment data chart (visibility is selectable in the settings).
Added Variance and Mean values to the Moment data chart.
Moved some plots around to see if I could get layering of the data to work, but it doesn't seem to make any difference to z-order of the plots.
Made the background all black, because that's cool and I want to be cool too.
Release Notes
Added indicators (+) which appear when the price has re-entered the regression channel - this often is an early indicator of an upcoming pivot (when the two colors disagree), or a weakening of momentum when there is an existing direction. When both of the indicators are the same color and they break the previous trend, then we can expect the pivot to be concrete if the next timeframe follows. Please note that this is heavily dependent on the deviation used. If the deviation is 1, then this will happen often and be meaningless. If the deviation is 2.5 or greater then exit and re-entry into the channel is a significant event. Added further details into the state of the various indicators used - can be disabled in the settings ; it's something I use for debugging and analyzing how the various indicators interact with each other to produce a plottable directional result.
Shifted to using volume weighted moving average in order to lessen the effects of movements outside trading hours / with futures.
Release Notes
Minor changes to usage descriptionRelease Notes
Removed channel fib lines and replaced with Support and Resistance points with the capability of selecting different S&R calculation types -- defaulted to Fib and default visibility is false -- don't want the chart to get too clutteredFixed some small bugs in the way entry and skew pivots are calculated
Removed variance from the value display and replaced with R-squared -- if the price movement is too erratic over the channel length, R-squared will drop and indicate that the data being provided for the regression is invalid
Added an setting to allow user to not display boxes on the chart when skew / kurtosis is above or below the critical values.
Open-source script
In true TradingView spirit, the author of this script has published it open-source, so traders can understand and verify it. Cheers to the author! You may use it for free, but reuse of this code in publication is governed by House rules. You can favorite it to use it on a chart.
Disclaimer
The information and publications are not meant to be, and do not constitute, financial, investment, trading, or other types of advice or recommendations supplied or endorsed by TradingView. Read more in the Terms of Use.