PROTECTED SOURCE SCRIPT
RN3 Ichimoku PVSRA Scalper Indicator
Updated
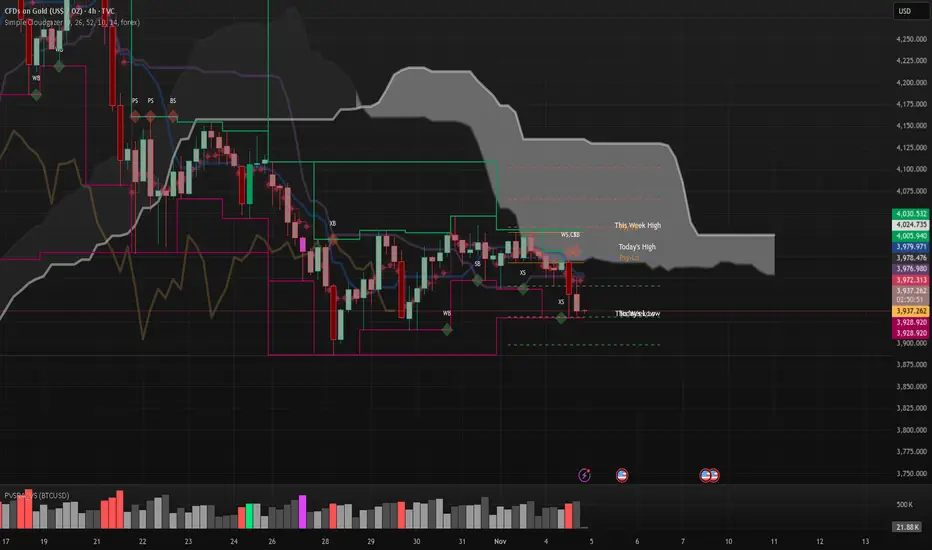
This indicator will place long (buy) and short (sell) orders using the Ichimoku Tenkan Kijun Cross strategy. When in a trade position, it will create take profit levels using Fibonacci against the highest high or lowest low of the past 2 days. You can define your own level and set your own stop loss just in case.
Senkou Span will act as your main bias.
if the price under the cloud so the bias will be bearish. You may want to focus on selling(short) on this direction.
if the price above the cloud so bias will be bullish, You may want to focus on buying(long) on this direction.
This is for scalping, but it possible to do swing.
Suggested Symbols : Forex / Crypto / Commodities
Timeframe for Entry : Less than 1D TF
Additional controls include:
PVSRA Candle
M Pivot
VWAP
B1: Yesterday High B2: Yesterday Low
C1: Today High C2: Today Low.
Here's the way you can utilize the script.
First look at the Yesterday high, and Yesteday Low.
You need to consider that would be the symbols can travel into.
If today high has broke yesteray high, there's possibly the price will can keep higher and will create new high. Likewise if today lowest broke yesterday low, there's possibly the price can keep dropping and create new low.
VWAP : You can use this to determine if the price is fair or not, the more it's trading away away the vwap this will determine if it's overbought, or oversold.
PVSRA :
using 10 Periods, it's determine the volume.
Blue(Bullish) and Pink(Bearish) the 150% more Volume from previous bar.
Green(Bullish) and Red(Bearish) the 200% more Volume from previous bar.
Release Notes
This indicator will place long (buy) and short (sell) orders using the Ichimoku Tenkan Kijun Cross strategy. If Price Kijun-Cross , this will show be possible entry. Then you need to wait until it show Strong Signal. When in a trade position, it will create take profit levels using Fibonacci against the highest high or lowest low of the past 2 days. You can define your own level and set your own stop loss just in case.
Senkou Span will act as your main bias.
if the price under the cloud so the bias will be bearish. You may want to focus on selling(short) on this direction.
if the price above the cloud so bias will be bullish, You may want to focus on buying(long) on this direction.
This is for scalping, but it possible to do swing.
Suggested Symbols : Forex / Crypto / Commodities
Timeframe for Entry : Less than 1D TF
Additional controls include:
PVSRA Candle
M Pivot
VWAP
B1: Yesterday High B2: Yesterday Low
C1: Today High C2: Today Low.
Here's the way you can utilize the script.
First look at the Yesterday high, and Yesteday Low.
You need to consider that would be the symbols can travel into.
If today high has broke yesteray high, there's possibly the price will can keep higher and will create new high. Likewise if today lowest broke yesterday low, there's possibly the price can keep dropping and create new low.
VWAP : You can use this to determine if the price is fair or not, the more it's trading away away the vwap this will determine if it's overbought, or oversold.
PVSRA :
using 10 Periods, it's determine the volume.
Blue(Bullish) and Pink(Bearish) the 150% more Volume from previous bar.
Green(Bullish) and Red(Bearish) the 200% more Volume from previous bar.
Release Notes
Update :- Now Fixed TP Position
- Added Trading Sentiment when VWAP Cross Price
Release Notes
Change Log : - Improved Visual
- Adding Alert For Potential,Strong Entry
Release Notes
Update : - Adding option to hide/display some signals.
- Added fibo range option to use daily open range.
- Potential Signal(PS/PB) terms name changed into Weak Signal(WS/WB)
Release Notes
Changelog : - Added Kumo Breakout Signal
- Fixed Chikou Exit
- Minor UI Fix
Release Notes
Changelog.- Added History Panel
- Changed Term KBS/KBB(Kumo Breakout Buy/Sell ) into breakout buy / breakout sell
- Fix some minor alert configuration
Release Notes
Changelog :- Changed the term "Cloud signal" to "breakout signal."
- Disabled Autofibo drawing on 4H and higher timeframes.
- Updated drawing computation: a breakout sell will now consider the last breakout buy as the target, and vice versa.
- Updated drawing computation: a strong sell will now consider the last breakout buy as the target, and vice versa.
Release Notes
- Changes UI for Daily High Visualization- Merged some signal into one icon
Release Notes
Changelog :- Re-initializes some UI
- Utilizing Exit Signal as momentum reversal signal.
- Adding Box Zones for existing Weak,Strong.
Release Notes
Change log- Fixing Some alert in All Alert Tag
- Adding Trading Session
Release Notes
Changelog :- Added Monthly psy line.
- Added Climax Signal : When volume 200%(buy or sell crossing the cloud)
- Added Rising Signal : When volume above average 150% (buy or sell crossing the cloud)
- Fix some minor UI issues.
Release Notes
- Change logTaking out history panel, and just record plain volume climax
Release Notes
Changelog.- Fixed publishing issues
Release Notes
- Changelog Attempt to fix Publish issuesRelease Notes
- ChangelogHistory table with switchable flag
Disclaimer
The information and publications are not meant to be, and do not constitute, financial, investment, trading, or other types of advice or recommendations supplied or endorsed by TradingView. Read more in the Terms of Use.