PROTECTED SOURCE SCRIPT
RSI Divergence Indicator (colorcoded and smoothed)
Updated
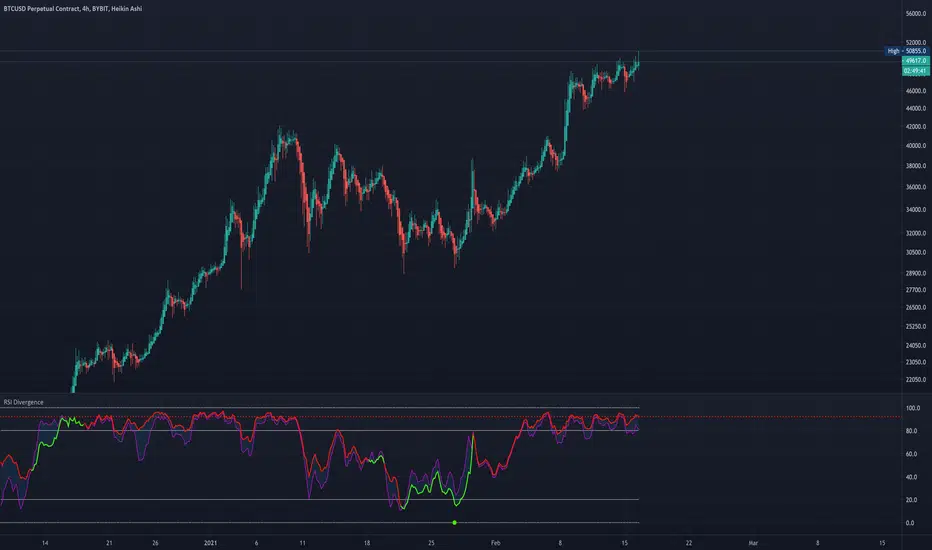
This indicator uses a custom RSI algorithm which displays a modified RSI and stochastic RSI as a simple to read and color coded oscillator.
When RSI turns green it signals a bullish divergence and considers the asset as overbought.
When it turns red it signals a bearish divergence and considers the asset oversold.
Overbought levels at 80 and oversold levels at 20.
Displaying the RSI this way removes the hassle to manually spot for divergences in the chart.
Only use this indicator in confluence with other indicators to confirm an upcoming trend.
This indicator features alarms when the indicator turns green or red.
Release Notes
Minor changesRelease Notes
Minor changesRelease Notes
Added Green Dot buy signalRelease Notes
Minor changesRelease Notes
Minor changesRelease Notes
Minor changesRelease Notes
Minor changesRelease Notes
Minor changesDisclaimer
The information and publications are not meant to be, and do not constitute, financial, investment, trading, or other types of advice or recommendations supplied or endorsed by TradingView. Read more in the Terms of Use.