OPEN-SOURCE SCRIPT
Daily Levels Percentual [TOLK] Settings Crypto and Forex
Updated
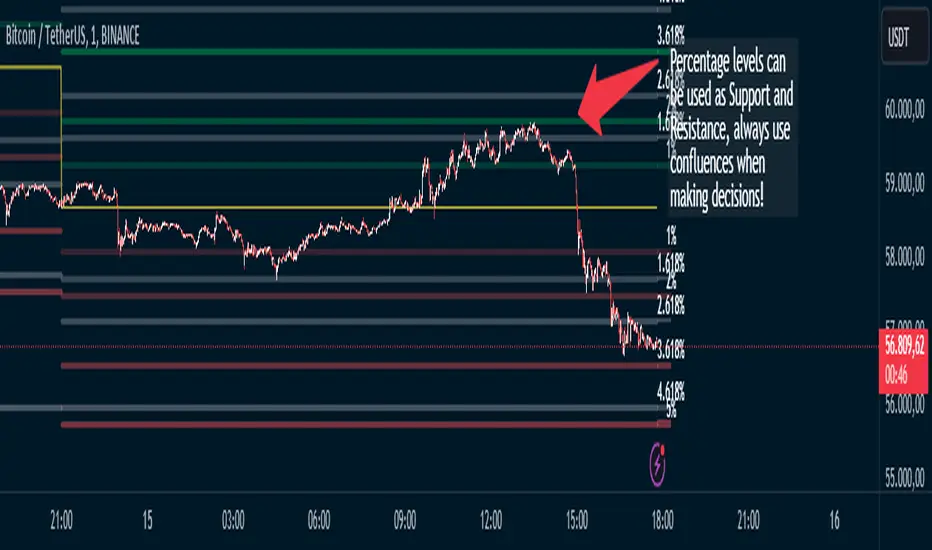
Percentage zones refer to specific areas or bands on the price chart of a financial asset that are bounded by percentages of change relative to a reference point, such as the opening price or a reference value from a previous move.
These zones are useful for identifying support and resistance levels, predicting possible price reversals, or setting price targets. For example, on a price chart, you can create percentage zones to observe how the price behaves when it reaches 1%, 2%, 5%, 10%, etc., above or below a certain point.
These zones can be used in conjunction with other technical analysis tools, such as Fibonacci, moving averages, or volume analysis, to improve decision-making in trading strategies.
The default indicator levels are as follows:
SETTINGS Crypto:
Crypto Level 1 > 1.0%
Crypto Level 2 > 1.618%
Crypto Level 3 > 2.0%
Crypto Level 4 > 2.618%
Crypto Level 5 > 3.618%
Crypto Level 6 > 4.618%
Crypto Level 7 > 5.0%
Crypto Level 8 > 7.618%
Crypto Level 9 > 10.0%
Crypto Level 10 > 12.618%
Crypto Level 11 > 13.618%
Crypto Level 12 > 15%
Crypto Level 13 > 17.618%
Crypto Level 14 > 20%
SETTINGS Forex:
Forex Level 1 > 0.10%
Forex Level 2 > 0.1618%
Forex Level 3 > 0.20%
Forex Level 4 > 0.2618%
Forex Level 5 > 0.3618%
Forex Level 6 > 0.4618%
Forex Level 7 > 0.50%
Forex Level 8 > 0.7618%
Forex Level 9 > 1.0%
Forex Level 10 > 1.2618%
Forex Level 11 > 1.3618%
Forex Level 12 > 1.50%
Forex Level 13 > 1.7618%
Forex Level 14 > 2.0%
Percentage Levels This approach helps identify critical price levels where the asset may encounter support or resistance, making it easier to make trading decisions based on price movement patterns.
Release Notes
UpdateRelease Notes
New Att.Release Notes
Update.Release Notes
UPRelease Notes
The indicator has been updated to include an option for choosing the percentage levels based on daily, weekly, or monthly periods. This allows users to select the timeframe for which they want to calculate and display the Fibonacci percentage levels, providing greater flexibility in analysis.Open-source script
In true TradingView spirit, the author of this script has published it open-source, so traders can understand and verify it. Cheers to the author! You may use it for free, but reuse of this code in publication is governed by House rules. You can favorite it to use it on a chart.
Disclaimer
The information and publications are not meant to be, and do not constitute, financial, investment, trading, or other types of advice or recommendations supplied or endorsed by TradingView. Read more in the Terms of Use.