OPEN-SOURCE SCRIPT
MACD Highlight Zones for Primetime

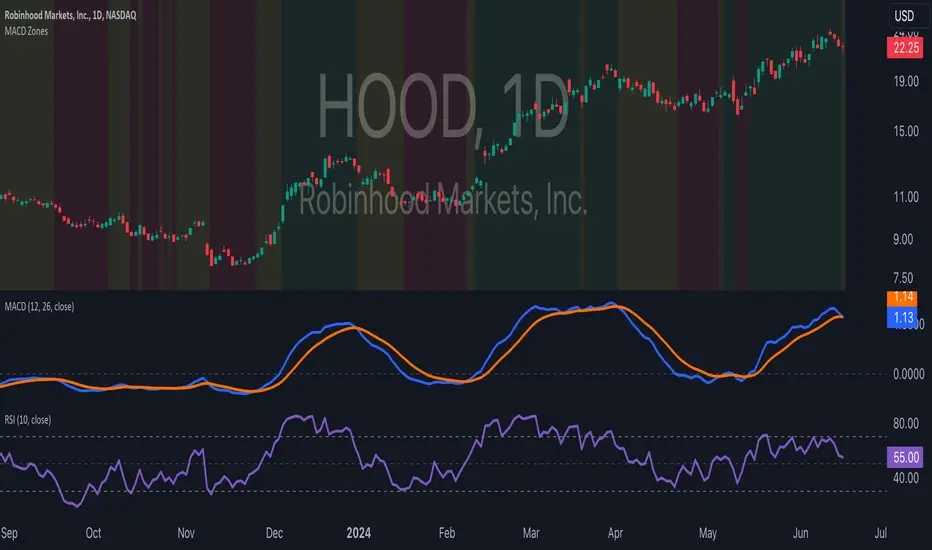
Use the MACD Highlight Zones to easily spot changes in market momentum and make more informed trading decisions.
The MACD Highlight Zones script visually enhances your chart by highlighting different zones based on the MACD's relationship to the zero line and its signal line. This script helps traders quickly identify the market's momentum and potential reversal points.
Features:
🟢 Green Background: Indicates the MACD line is above 0, signaling bullish momentum.
🟡 Yellow Background: Indicates the MACD line crosses the signal line, suggesting a potential momentum shift.
🔴 Red Background: Indicates the MACD line is below 0, signaling bearish momentum.
Open-source script
In true TradingView spirit, the author of this script has published it open-source, so traders can understand and verify it. Cheers to the author! You may use it for free, but reuse of this code in publication is governed by House rules. You can favorite it to use it on a chart.
Disclaimer
The information and publications are not meant to be, and do not constitute, financial, investment, trading, or other types of advice or recommendations supplied or endorsed by TradingView. Read more in the Terms of Use.