INVITE-ONLY SCRIPT
Litt Opening Range Breakout
Updated

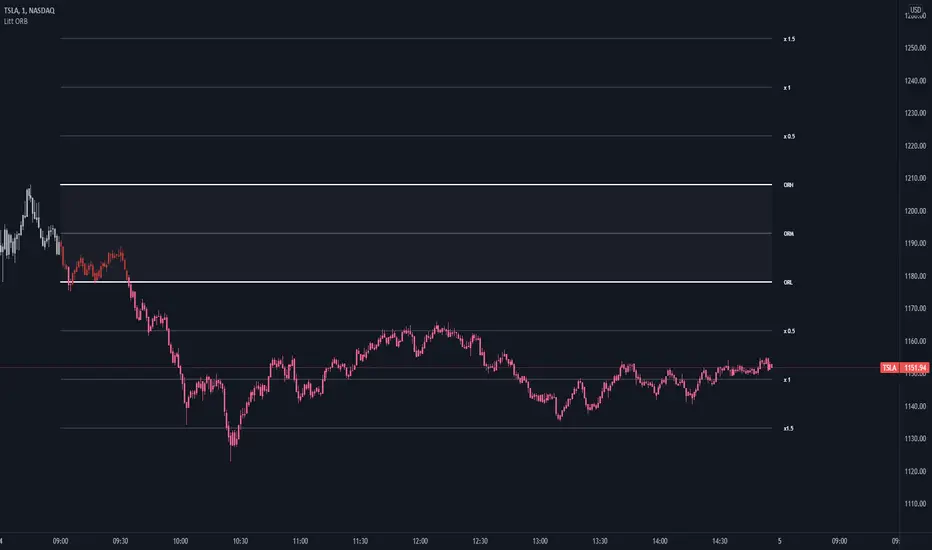
The Litt ORB, Opening Range Breakout, is a tool used by many intraday traders to take advantage of short-term momentum. This script plots extensions based on the opening range and then color candles depending on where the closing price of that candle is. The opening range is defined by either the first 30 or 60 minutes of a new trading day. During that time the opening ranges are set. If the opening range time has passed and we start to break above the Opening Range High that is a good indication that a Trend Day to the upside could be forming. When a stock takes out the range high from the first 30 or 60 minutes this is called an Opening Range Breakout.
OR = Opening Range
ORH = Opening Range High
ORL = Opening Range Low
ORM = Opening Range Mid (Half-way between ORH and ORL)
You can see the ORH and ORL (Opening Range) lines on the chart. The other lines are extension lines from the Opening Range. These are used as price targets for the end of Opening Range breakouts.
The candles are colored as follows.
If we are above the ORH then we use Bull Color 1.
If we are below the ORL then we use Bull Color 2.
If we are above the ORM, Opening Range Mid or the halfway point between the ORH and the ORL, we color Bull Color 2.
If we are below the ORM then we color Bear Color 2.
If the current time is still within the Opening Range then we color the Opening Range Color.
OR = Opening Range
ORH = Opening Range High
ORL = Opening Range Low
ORM = Opening Range Mid (Half-way between ORH and ORL)
OR = Opening Range
ORH = Opening Range High
ORL = Opening Range Low
ORM = Opening Range Mid (Half-way between ORH and ORL)
You can see the ORH and ORL (Opening Range) lines on the chart. The other lines are extension lines from the Opening Range. These are used as price targets for the end of Opening Range breakouts.
The candles are colored as follows.
If we are above the ORH then we use Bull Color 1.
If we are below the ORL then we use Bull Color 2.
If we are above the ORM, Opening Range Mid or the halfway point between the ORH and the ORL, we color Bull Color 2.
If we are below the ORM then we color Bear Color 2.
If the current time is still within the Opening Range then we color the Opening Range Color.
OR = Opening Range
ORH = Opening Range High
ORL = Opening Range Low
ORM = Opening Range Mid (Half-way between ORH and ORL)
Release Notes
-Remove linksInvite-only script
Access to this script is restricted to users authorized by the author and usually requires payment. You can add it to your favorites, but you will only be able to use it after requesting permission and obtaining it from its author. Contact Steadylit for more information, or follow the author's instructions below.
TradingView does not suggest paying for a script and using it unless you 100% trust its author and understand how the script works. In many cases, you can find a good open-source alternative for free in our Community Scripts.
Author's instructions
″To gain access to our indicators become a Steady Trader today! https://www.officialsteadytrades.com/
Want to use this script on a chart?
Warning: please read before requesting access.
Disclaimer
The information and publications are not meant to be, and do not constitute, financial, investment, trading, or other types of advice or recommendations supplied or endorsed by TradingView. Read more in the Terms of Use.