OPEN-SOURCE SCRIPT
Updated [blackcat] L1 T3 MA Lite Version
Tilson T3 Moving Average (T3MA) is a type of moving average line designed to reduce lag and improve the accuracy of trend identification. It is based on a combination of multiple smoothed moving averages, with each subsequent smoothed moving average having a higher weight than the previous one. The T3MA formula includes three different smoothing coefficients and a volume coefficient or volatility coefficient, which can be adjusted according to user preferences. T3MA is commonly used by traders and investors to identify trends and generate trading signals.
The calculation method for T3MA requires the use of exponential moving averages (EMA). In Pine scripts in the TradingView community, over 90% of them use the EMA function to calculate T3MA. Specifically, in Pine scripts, it is necessary to define the length and volatility coefficient of T3MA, then calculate three different lengths of EMA separately. Next, three constants need to be calculated that are related to volatility. Finally, the weighted average value of the three EMAs and three constants is added together to obtain the value of T3MA. If you want to customize the length and volatility of T3MA, you just need to modify the parameters in the code. Overall, T3MA is a very useful technical indicator that can help traders better understand market trends and improve trading efficiency.
The improved version introduced today mainly addresses my perception that traditional T3 algorithms are too redundant with high computational complexity leading to delayed reactions. Therefore, I have developed a lightweight version called [blackcat] L1 T3 MA Lite Version. This doesn't bring about any qualitative changes; it simply makes adjustments in terms of computational resources and response speed. To illustrate its advantages compared with traditional T3 MA indicators, I will provide a comparison using Everget's script from TradingView community blogger everget.
The difference between these two scripts for calculating T3 Moving Average lies in their implementation methods. The first script (Everget) uses a more complex calculation formula, which requires calculating three different lengths of EMA and computing three constants based on volatility. Finally, they are weighted averaged to obtain T3MA. This complex calculation formula can enhance the sensitivity of the T3MA indicator, thereby better identifying price trends. On the other hand, the second script (Blackcat1402) uses a relatively simple calculation formula that only requires calculating three different lengths of EMA and computing three constants based on volatility. Finally, they are weighted averaged to obtain T3MA as well. This simple calculation formula reduces computational complexity and speeds up calculations. Both have slightly different effects and calculation methods; users can choose the script that suits their needs.
In summary, T3 Moving Average is a very useful technical indicator that can help traders better understand market trends and improve trading efficiency. Users can choose scripts suitable for themselves according to their needs and flexibly adjust the length and volatility coefficient of T3MA to adapt to different markets.
Release Notes
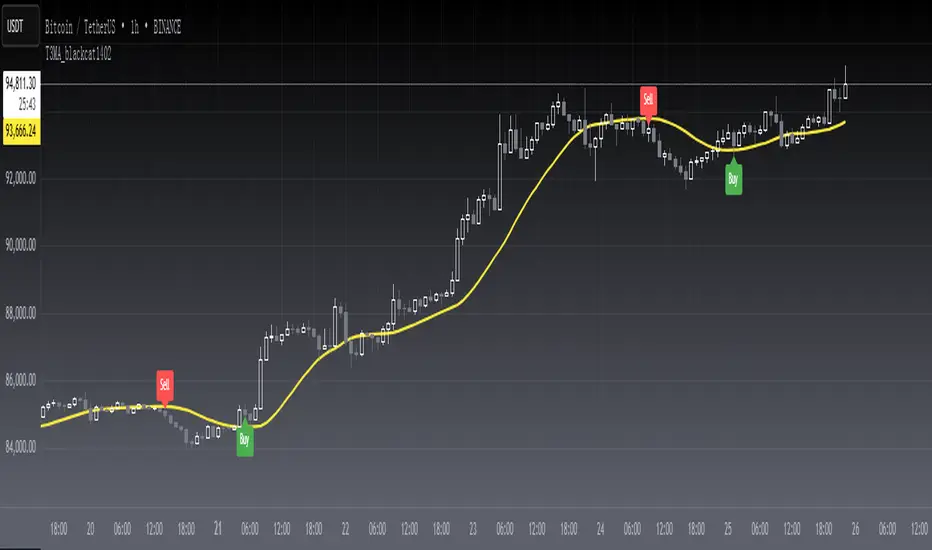
OVERVIEWThe [blackcat] L1 T3 MA Lite Version is an efficient implementation of the Triple Exponential Moving Average (T3 MA). This lightweight version offers improved performance without sacrificing accuracy, providing traders with a reliable tool for identifying trends and potential entry/exit points. The indicator plots the T3 MA line on the chart and generates alerts for crossover events, helping users make informed trading decisions 📊✅.
FEATURES
Calculates the Triple Exponential Moving Average (T3 MA) using a custom function:
Length: Defines the period over which the moving average is calculated.
Source: Allows selection of the price series (default: close).
Volatility Factor: Adjusts the sensitivity of the moving average based on market conditions.
Plots the T3 MA line on the chart with a bright yellow color for clear visibility 🎨
Generates buy ('Buy') and sell ('Sell') labels upon crossover events for quick identification 🏷️
Provides alerts when crossover signals occur, ensuring timely notifications 🔔
HOW TO USE
Add the indicator to your TradingView chart by selecting it from the indicators list.
Customize the Length, Source, and Volatility Factor parameters as needed ⚙️.
Observe the T3 MA line on the chart to track smoothed price trends.
Look for buy and sell labels indicating potential trade opportunities.
Set up alerts based on the generated signals to receive notifications when conditions are met 📲.
LIMITATIONS
The indicator might lag behind rapid price movements due to its smoothing nature.
Users should experiment with different settings to optimize performance for their specific assets and timeframes.
The effectiveness of the indicator may vary depending on market conditions.
NOTES
Ensure that you have sufficient historical data available for accurate calculations.
Test the indicator thoroughly on demo accounts before applying it to live trading 🔍.
Fine-tune the volatility factor to achieve the desired balance between smoothness and responsiveness.
Open-source script
In true TradingView spirit, the creator of this script has made it open-source, so that traders can review and verify its functionality. Kudos to the author! While you can use it for free, remember that republishing the code is subject to our House Rules.
Avoid losing contact!Don't miss out! The first and most important thing to do is to join my Discord chat now! Click here to start your adventure: discord.com/invite/ZTGpQJq 防止失联,请立即行动,加入本猫聊天群: discord.com/invite/ZTGpQJq
Disclaimer
The information and publications are not meant to be, and do not constitute, financial, investment, trading, or other types of advice or recommendations supplied or endorsed by TradingView. Read more in the Terms of Use.