PROTECTED SOURCE SCRIPT
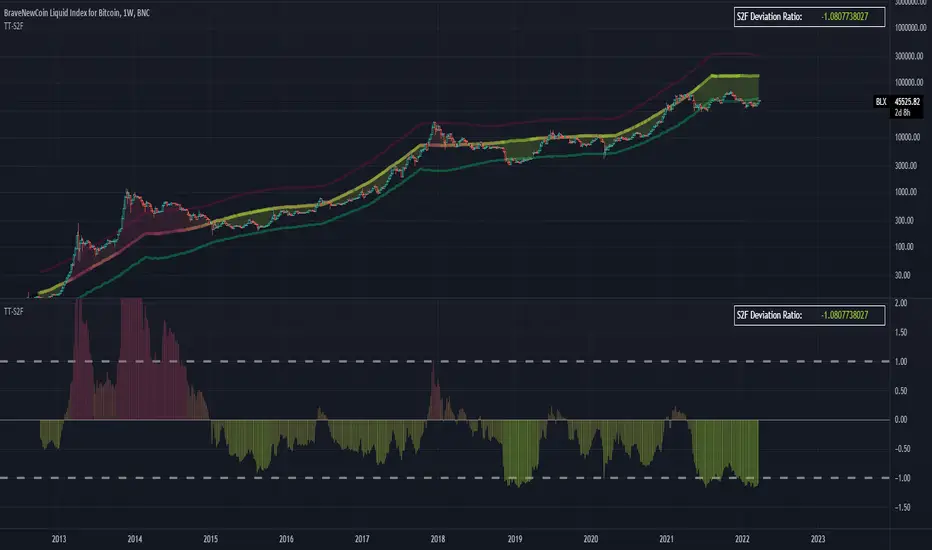
TrendTracers Bitcoin Stock to Flow Model

For the best results, make sure to view this indicator on a bitcoin chart with a very long history (e.g. BNC:BLX)!
This model treats Bitcoin as being comparable to commodities such as gold, silver or platinum. These are known as ‘store of value’ commodities because they retain value over long time frames due to their relative scarcity. It is difficult to significantly increase their supply i.e. the process of searching for gold and then mining it is expensive and takes time. Bitcoin is similar because it is also scarce. In fact, it is the first-ever scarce digital object to exist. There are a limited number of coins in existence and it will take a lot of electricity and computing effort to mine the remaining coins still to be mined, therefore the supply rate is consistently low.
The stock-to-flow model predicts value changes in a straightforward manner. It compares an asset’s current stock to the rate of new production, or how much is produced in a year.
Calculation:
Take bitcoin production in a period, divide it by that period and then multiply by 365 to get the estimated yearly production and then calculate the stock to flow.
yearlyFlow = ((stockChange) / period ) * 365
stockToFlow = (stock - missingBitcoins) / yearlyFlow
Model Value = -1.84ᵉ * stockToFlow³.³⁶ (mathematical model to calculate the model price)
For more information about the calculations followed: stats.buybitcoinworldwide.com/stock-to-flow/
Features:
I just noticed that, while the color gradient function is pretty cool, it does not allow for end users to customize their colors after applying this indicator to their chart. Sorry!
This model treats Bitcoin as being comparable to commodities such as gold, silver or platinum. These are known as ‘store of value’ commodities because they retain value over long time frames due to their relative scarcity. It is difficult to significantly increase their supply i.e. the process of searching for gold and then mining it is expensive and takes time. Bitcoin is similar because it is also scarce. In fact, it is the first-ever scarce digital object to exist. There are a limited number of coins in existence and it will take a lot of electricity and computing effort to mine the remaining coins still to be mined, therefore the supply rate is consistently low.
The stock-to-flow model predicts value changes in a straightforward manner. It compares an asset’s current stock to the rate of new production, or how much is produced in a year.
Calculation:
Take bitcoin production in a period, divide it by that period and then multiply by 365 to get the estimated yearly production and then calculate the stock to flow.
yearlyFlow = ((stockChange) / period ) * 365
stockToFlow = (stock - missingBitcoins) / yearlyFlow
Model Value = -1.84ᵉ * stockToFlow³.³⁶ (mathematical model to calculate the model price)
For more information about the calculations followed: stats.buybitcoinworldwide.com/stock-to-flow/
Features:
- Works on the Daily, Weekly and Monthly Timeframe.
- Allows you to adjust between a 10-day period and a 463-day period.
- Has the option to account for missing bitcoins, lets you adjust the amount of missing bitcoins.
- The ability to toggle a standard deviation of the Model Value with a multiplier of 1, 2 or 3
- Displays a Stock to Flow Deviation Ratio: If the Deviation Ratio is close to 0 it means the price of Bitcoin is close to the Model Value Line(or Stock to Flow Ratio). If the Deviation Ratio is close to 1 or -1, it means the price of bitcoin is near the selected deviation levels.
- You can toggle between the Overlay version and the Oscillator version, default is on Oscillator version. If you want to switch: Untick Oscillator mode in the indicator settings, click on the three dots and select "move to existing pane above". Then click on the three dots again and select Pin to scale A. Done!
- As a bonus: Now you can toggle a "1-year Realized Price" graph, while it's not officially part of the Stock to Flow Model it does share similar technicals about supply and scarcity. The 1-year Realized Price is the realized market cap divided by total amount of generated coins.
I just noticed that, while the color gradient function is pretty cool, it does not allow for end users to customize their colors after applying this indicator to their chart. Sorry!
You can find more Technical Analysis and shared positions in our community, if you’re interested in hearing our experiences and learning more about our indicators along with the risk management we apply, feel free to join here: discord.gg/CsB9JtU
Disclaimer
The information and publications are not meant to be, and do not constitute, financial, investment, trading, or other types of advice or recommendations supplied or endorsed by TradingView. Read more in the Terms of Use.