TrEx S/R Levels [ETPINVEST]TrEx S/R Levels - User Guide
🎯 WHAT IS THIS INDICATOR?
TrEx S/R Levels is a professional indicator for automatically building support and resistance levels based on algorithmic analysis of price extremes.
🔍 WHAT IS IT USED FOR?
Main tasks:
Key level identification - automatic search for significant support and resistance levels based on extremes
Entry and exit planning - using levels for order placement
Movement strength analysis - evaluating the probability of breakout or bounce from a level considering the number of touches
Risk management - displaying level values and % movement to levels from current price for calculating stop-losses and take-profits
Who is it suitable for:
📈 Swing traders - for medium-term trading
⚡ Day traders - for intraday trades
🎯 Scalpers - for precise entries on lower timeframes
📊 Analysts - for technical market analysis
⚙️ HOW DOES THE ALGORITHM WORK?
1. Extreme search
The indicator uses a complex algorithm to find significant highs and lows through strictly defined candle combinations forming extremes.
Validation - verification of compliance with strict mathematical conditions
2. Level construction
Based on found extremes, verification of compliance with strict mathematical conditions is performed with a slight bias in priority to recent extremes to clarify level relevance.
Resistance levels (red) - from upper extremes
Support levels (green) - from lower extremes
Precise positioning - priority-based shifting on extremes
3. Smart clustering
Closely positioned levels are automatically merged:
Smart merging - using ATR to determine proximity
Weighted averaging - considering the strength of each level
Touch counting - accumulating significance of merged levels
🛠️ DETAILED SETTINGS DESCRIPTION
📊 Support/Resistance Levels
Support Color / Resistance Color
Purpose: Colors of support and resistance level lines
Default: Green for support, red for resistance
Level Width
Range: 1-5 pixels
Default: 1
Purpose: Thickness of level lines
Level Style
Options: Solid, Dashed, Dotted
Default: Solid
Purpose: Display style of level lines
Clustering Multiplier
Range: 0.1 - 2.0
Default: 0.7
Purpose: Coefficient for merging close levels through ATR
How it works:
0.1-0.5 - strict merging (only very close levels)
0.6-1.0 - moderate merging (recommended)
1.1-2.0 - soft merging (may be too aggressive)
Analysis Depth
Range: 50-300 bars
Default: 200
Purpose: Depth of historical analysis for extreme search for level construction
Show Level Info
Default: Enabled
Purpose: Display of informational labels
Label content: Touches | Price | Distance%
Example: 3 | 1.2567 | 2.1%
📈 PRACTICAL USAGE TIPS
🎯 Trading strategies
1. Trading from levels
✅ Buy signal:
Price approaches support level (green line)
Reversal pattern forms (e.g., double bottom or hammer)
Volume increases on bounce
✅ Sell signal:
Price approaches resistance level (red line)
Reversal pattern forms (e.g., double top)
Volume increases on bounce
2. Breakout trading
✅ Buy signal:
Resistance level breakout with high volume
Price consolidation above the level
Retest of broken level as support
✅ Sell signal:
Support level breakout with high volume
Price consolidation below the level
Retest of broken level as resistance
💡 Settings optimization
For scalping (M1-M5):
Analysis Depth: 100-150
Clustering Multiplier: 0.5-0.7
Level Width: 1-2
For day trading (M15-H1):
Analysis Depth: 150-200
Clustering Multiplier: 0.6-0.8
Level Width: 2-3
For swing trading (H4-D1):
Analysis Depth: 200-300
Clustering Multiplier: 0.7-1.0
Level Width: 2-4
⚠️ IMPORTANT FEATURES
✅ Advantages:
Automation - no manual level construction required
Accuracy - uses complex mathematical algorithms
Adaptability - adjusts to any asset and timeframe
Informativeness - shows the strength of each level
⚠️ Limitations:
Requires history - needs minimum 50 bars for correct operation
🎯 CONCLUSION
TrEx S/R Levels is a powerful tool for automatic analysis of support and resistance levels. The indicator is suitable for traders of any level and can significantly simplify the technical analysis process.
Сопротивление

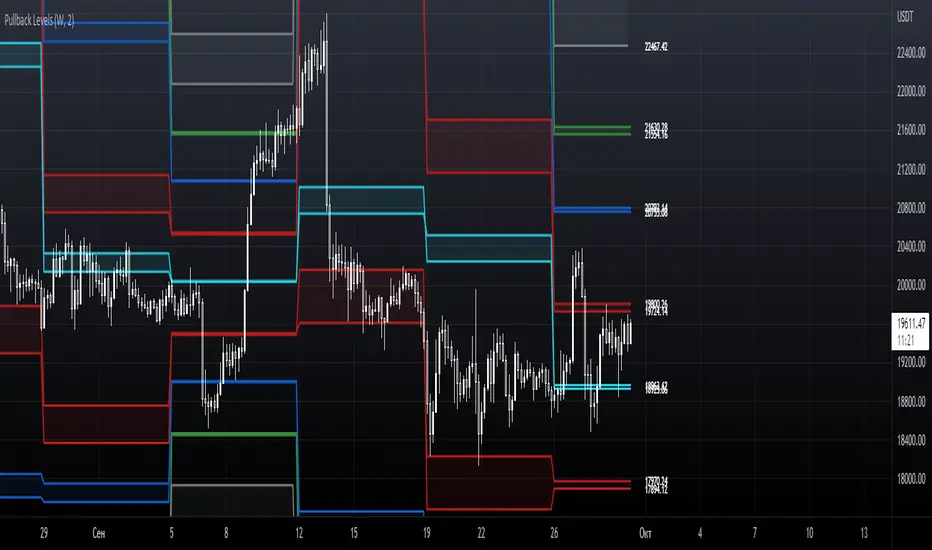
Pullback LevelsPullback Levels is a technical indicator for predicting large price movements by calculating support and resistance levels. It is used to determine the general market trend on different timeframes. Pullback levels are used when prices are built above or below them, indicating the priority direction of movement.
Analysis of support and resistance levels often coincides with the action levels of large players, similar to the analysis of a trend line. When analyzing Pullback levels, the first support and resistance levels are calculated using the width of the trading range and the volume traded during this period. The second support and resistance levels are calculated using the larger trading range width given the highs and lows.
It also provides the ability to flexibly adjust the levels, their visualization, style, calculation methods and the used timeframe. For the convenience of backtesting, all historical levels are saved on the chart. To analyze current price movements and determine pullbacks, all prices are displayed next to the levels.
-------------------------------------------
Pullback levels – технический индикатор для прогнозирования крупных ценовых движений путем расчета уровней поддержки и сопротивления . Используется для определения общего рыночного тренда на различных таймфреймах. Pullback levels используются при построение цены выше или ниже них, указывая на приоритетное направление движения.
Анализ уровней поддержки и сопротивления часто совпадает с уровнями действия крупных игроков, наподобие анализа трендовой линии. При анализе Pullback уровней первые уровни поддержки и сопротивления рассчитываются с использованием ширины торгового диапазона и объёмом проторгованным за этот период. Вторые уровни поддержки и сопротивления рассчитываются с использованием более старшей ширины торгового диапазона учитывая максимумы и минимумы.
Он так же предоставляет возможность гибкой настройки уровней - их визуальной составляющей, стиля, методов расчёта и используемого таймфрейма. Для удобства бэктестинга все исторические уровни сохраняются на графике. Для анализа текущих ценовых движений и определении точек разворота, все цены находятся рядом с уровнями.
Pivot Points by stelmaxFor pivot levels, we use different definitions of the pivot point. In fact, there are three different methods to calculate the reference level using this method.
For these pivot points, we set the variable x, the value of which depends on whether the open is higher or lower than the close.
If the close is less than the open, x = H + 2L + C.
If the close is higher than the open, x = 2H + L + C.
When open equals close, x = H + L + 2C
This final value will be one of the most commonly used designs. This is because, as FX is a 24 hour market, the open is almost always equal to the close.
If you look at the daily chart throughout the week, the close and the open are really just names. This is in contrast to the stock market, where the open and close are very different things, separated by time and price.
Once we have the pivot point and the x-value, we use it to compute the pivot point of the base P.
P = x / 4
Support and resistance levels are also calculated from x (pivot points do not use more than one support and resistance level).
S₁ = x / 2 - H
S₂ = x / 2 - L
Thus, we have seen how to calculate different types of Pivot Points indicator. But how can we now use them in our trade?
First, we can use our anchor point to define the general direction. - If the existing market price is above the key PP level, it suggests a bullish trend.
- If the market is below the key PP level, it suggests a bearish trend.
Pivot levels are set according to the value of the previous trading day.
+ If the price is below the PP pivot level - priority is given to sell deals, if higher - to purchases
+ Confirmatory signals can be candlestick patterns and the Stochastic indicator
+ The SL level can be set either for a signal candle or for the nearest level
+ Target - movement to the nearest support / resistance level
Keep in mind that the Pivot Level Indicator is not a complete trading system!
Remember that there are no indicators in trading that do not make mistakes, Pivot Points, like any others, require confirmation of their signals. When building your own trading system, use several indicators.
Observe Money Management. Never risk more than 2 percent of your capital in one trade. This approach will protect you from ruin and will allow you to consistently make money on Forex using the Pivot Point.
Be clear about your trading strategy. If, according to the pivot point strategy, you need to open a deal - open, if you fix the result - fix it, and it doesn't matter if you are in the black or not. Only following the rules of Pivot Points "from and to" will allow you to earn.
