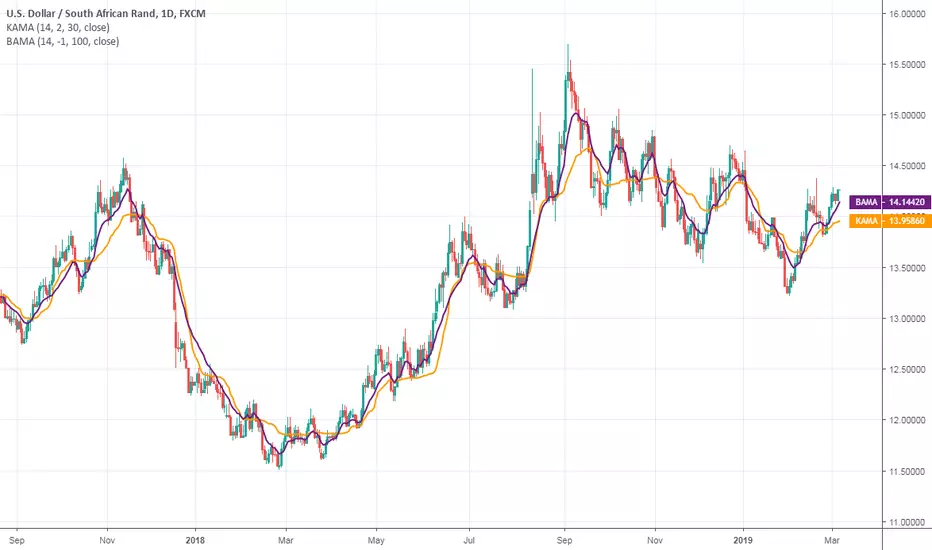
Bryant Adaptive Moving Average@ChartArt got my attention to this idea.
This type of moving average was originally developed by Michael R. Bryant (Adaptrade Software newsletter, April 2014). Mr. Bryant suggested a new approach, so called Variable Efficiency Ratio (VER), to obtain adaptive behaviour for the moving average. This approach is based on Perry Kaufman' idea with Efficiency Ratio (ER) which was used by Mr. Kaufman to create KAMA.
As result Mr. Bryant got a moving average with adaptive lookback period. This moving average has 3 parameters:
Initial lookback
Trend Parameter
Maximum lookback
The 2nd parameter, Trend Parameter can take any positive or negative value and determines whether the lookback length will increase or decrease with increasing ER.
Changing Trend Parameter we can obtain KAMA' behaviour
To learn more see www.adaptrade.com
Adaptive
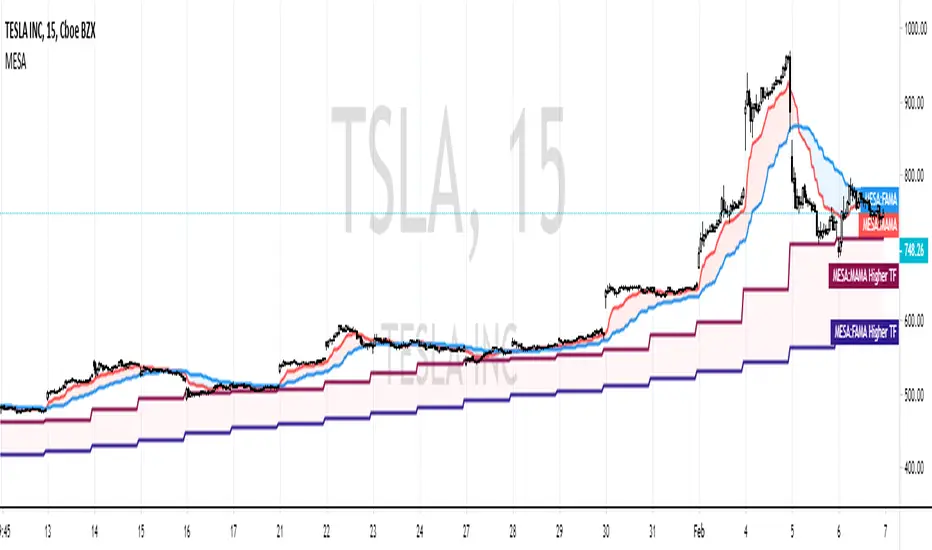
MESA Adaptive Moving AverageIntro
One of Ehlers most well-known indicators! I've seen many variations of this on TradingView, however, none seem to be true to the original released by Ehlers himself.
I've taken it upon myself to simply translate the MAMA into Pinescript, instead of re-writing like some others have done.
You can use it as a very effective & adaptive moving average with other signals or
as a standalone signal.
In the case that you're going to use it for signals and not simple technical trading (non-quantitative),
I've also added a threshold parameter to filter out weak signals.
My MAMA indicator is different from others in very simple ways - I don't use the nz() command, which sets all "Not a Number" values to 0. In others' scripts, you immediately load the indicator with several 0 values,
causing a slight lag in future calculations since this code is recursive (refers to previous values it generated).
In my version, I simply wait until the script has access to all the bar data it needs, instead of instantly performing calculations and
setting erroneous values to 0. In this case, we start with the correct values (or closer to correct).
If you want to compare this indicator the current most popular MAMA by LazyBear, you'll notice it often gives buy and sell crosses one bar earlier than theirs.
Setting Parameters
Source - the data series to perform calculations on. (Initially, Ehlers himself favored hl/2, but conceded that there isn't empirical benefit over close.)
Fast Limit - controls how quickly the MAMA will "ratchet up" fast price action. (Higher values are faster)
Slow Limit - controls how closely the FAMA will follow the MAMA. (Again, higher is faster. You typically want the FAMA to be slower though.)
Crossover Threshold - simple error thresholding to limit the number of weak trade signals. (Lower means lower tolerance)
Show Crosses? - show/hide the arrows at moving average crosses
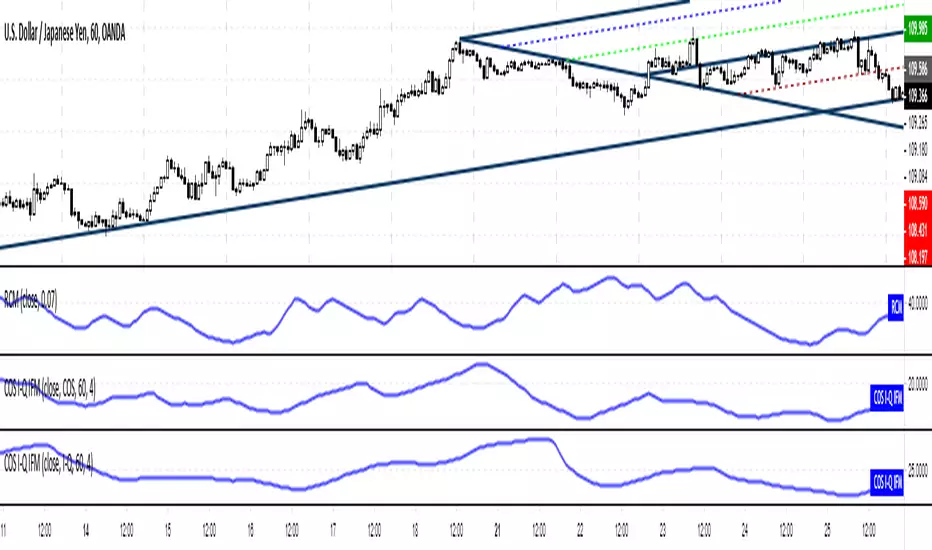
Robust Cycle Measurement [Ehlers]The last of Ehlers Instantaneous Frequency Measurement methods.
This is a more robust version of this script.
I wrote it as a function, so you can simply copy and paste it into any script to add an adaptive period setting capability.
Cheers,
DasanC
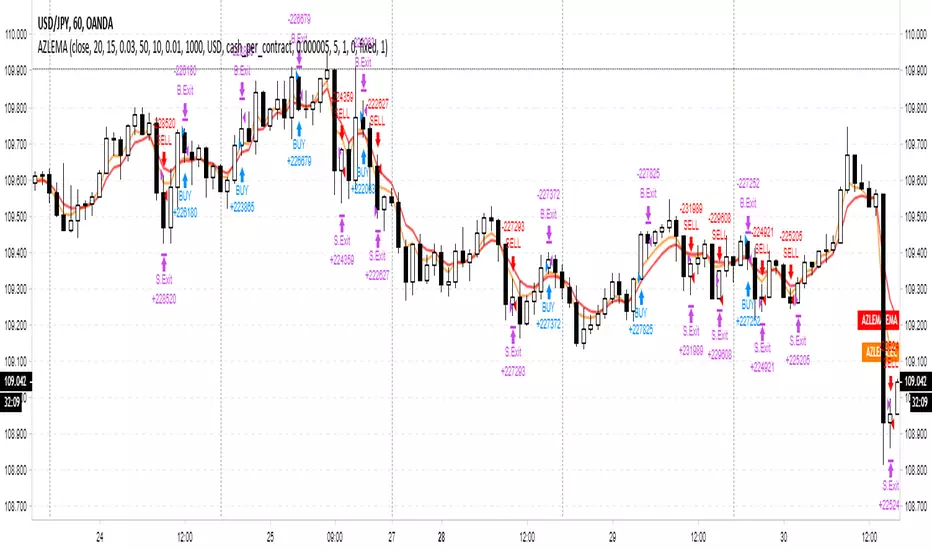
Adaptive Zero Lag EMA v2This is my most successful strategy to date! Please enjoy and join the Open Source movement by sharing your code and ideas online!
OPERATING PRINCIPLE
The strategy is based on Ehlers idea that any indicator can be turned into a signal-producing trade system through smoothing and other filtering processes.
In fact, I'm using his Zero Lag EMA (ZLEMA) as a baseline indicator as well as some code snippets he has made public (1). God bless open source!
Next, I've provided the option to use an Instantaneous Frequency Measurement (IFM) method, which will adaptively choose the best period for the ZLEMA (2)
I've written other studies that use the differential calculus approximations for IFM, so it was only natural to include them in this strategy.
The primary two are Cosine IFM (3) and In-phase Quadrature IFM (4). You can also find an indicator with both plotted and the ability to average them together, as one IFM prefers long periods and the other short. (5)
BEFORE WE BEGIN
1. This strategy only runs on "normal" FX pairs (EURUSD, GBPJPY, AUDUSD ...) and will fail on Metals or Commodities.
Cryptos are largely untested.
2. Please run it on these time frames: M15 to D.
Anything outside this range will likely fail.
HOW TO USE AND SUCCEED
1. If the Default settings don't produce good results right off the bat, then lower gain limit to 1 or 2 and threshold to 0.01.
2. Test each setting under adaptive method . If you want to leave it Off , then I'd recommend using some kind of IFM (see my links below) to
discover the most efficient period to use.
3. Once you have the best adaptive method chosen, begin incrementing gain limit until you find a nice balance between profit factor (PF) and drawdown.
4. Now, begin incrementing threshold . The goal is to have PF above 2 and a drawdown as low as possible.
5. Finally, change the source ! Typically, close is the best option, but I have run into cases where high
yielded the highest returns and win rate.
6. Sit back, relax, and tweak the risk until you're happy with the return and drawdown amounts.
ADVANCED
You may need to adjust take profit (TP) points and stop loss (SL) points to create the best entry possible. Don't be greedy! You'll likely have poor
results if the TP is set to 300 and SL is 50.
If you are trading a pair that has a long Dominant Cycle Period , then you may increase Max Period to allow the IFM
to accept longer periods. Any period above the Max Period will be rejected. This may increase lag time!
Cheers and good luck trading!
-DasanC
PS - This code doesn't repaint or have future-leak, which was present in Pinescript v2.
PPS - Believe me! These returns are typical! Sometimes you must push aside the "if it's too good to be true..." mindset that society has ingrained in you.
Do you really believe the most successful pass up opportunities before investigating them? ;)
(1) Ehlers & Ric Zero Lag EMA
(2) Measuring Cycles by Ehlers
(3) Cosine IFM
(4) Inphase Quadrature IFM
(5) Averaging IFM

Low Lag Exponential Moving AverageThis is a low-lag EMA, colorized to help identify turn around points. You have the option of making it adaptive as well, different methods
of signal processing or simply an average of the two.
See my previous script to understand how these adaptive methods work

Adaptive Bandpass Filter [Ehlers]This is my latest bandpass filter - used to determine if a security is in a trend or cycle.
Now with an adaptive period setting! I use Ehlers in-phase & quadrature dominant cycle measurement (IQ IFM) method to set the period dynamically.
This method favors longer periods which tend to produce smoother, albeit laggier bandpass oscillator plots. From my quick tests, I tend to have lag between 4 and 8 bars, depending on the Timeframe.
The lower timeframes tend to have more noise and thus produce more interfering frequencies that may cause lag.
>Settings
Source: Select the data source to perform calc's on (close, open, etc...)
Period: Select the period to tune. Periods outside of this value will be attenuated (reduced)
Adaptive: Enable to have the I-Q IFM set the period for you (disables Period setting)
Bandpass Tolerance: Allow periods that are plus/minus the chosen period to pass.
Cycle Tolerance: Sensitivity of cycle mode. Lower values consider trends more frequent, higher values consider cycles more frequent.
Bandpass tolerance example: for instance, if this setting is 0.1 (10%) and Period is set to 20, then waves with a period of 18 - 22 will pass.
>How to read
Red line is the bandpass output, showing a lagged version of the dominant cycle representing the
Black lines are the upper and lower bounds for a cycle
Green Background indicates an uptrend
Red background indicates a downtrend

Adaptive Zero Lag EMA Strategy [Ehlers + Ric]Behold! A strategy that makes use of Ehlers research into the field of signal processing and wins so consistently, on multiple time frames AND on multiple currency pairs.
The Adaptive Zero Lag EMA (AZLEMA) is based on an informative report by Ehlers and Ric .
I've modified it by using Cosine IFM, a method by Ehlers on determining the dominant cycle period without using fast-Fourier transforms
Instead, we use some basic differential equations that are simplified to approximate the cycle period over a 100 bar sample size.
The settings for this strategy allow you to scalp or swing trade! High versatility!
Since this strategy is frequency based, you can run it on any timeframe (M1 is untested) and even have the option of using adaptive settings for a best-fit.
>Settings
Source : Choose the value for calculations (close, open, high + low / 2, etc...)
Period : Choose the dominant cycle for the ZLEMA (typically under 100)
Adaptive? : Allow the strategy to continuously update the Period for you (disables Period setting)
Gain Limit : Higher = faster response. Lower = smoother response. See for more information.
Threshold : Provides a bit more control over entering a trade. Lower = less selective. Higher = More selective. (range from 0 to 1)
SL Points : Stop Poss level in points (10 points = 1 pip)
TP Points : Take Profit level in points
Risk : Percent of current balance to risk on each trade (0.01 = 1%)
www.mesasoftware.com
www.jamesgoulding.com(Measuring%20Cycles).doc
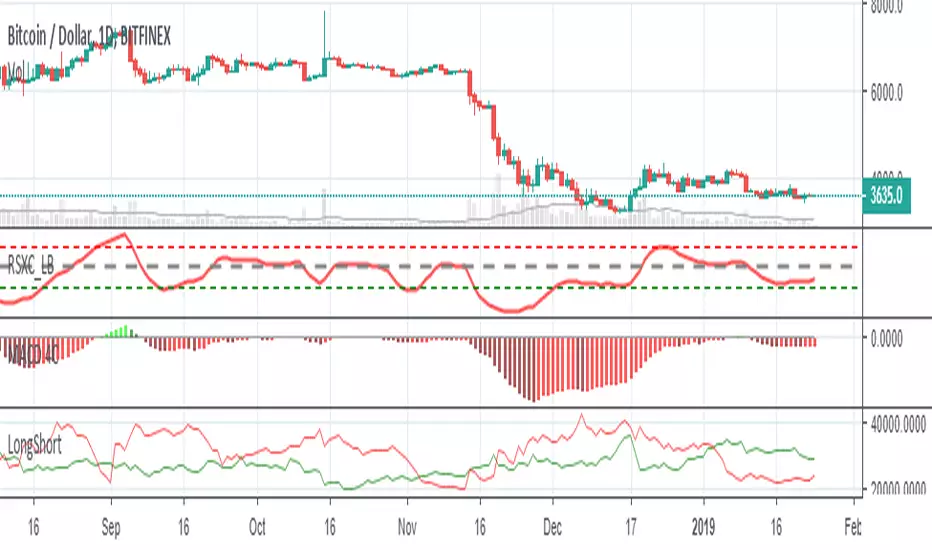
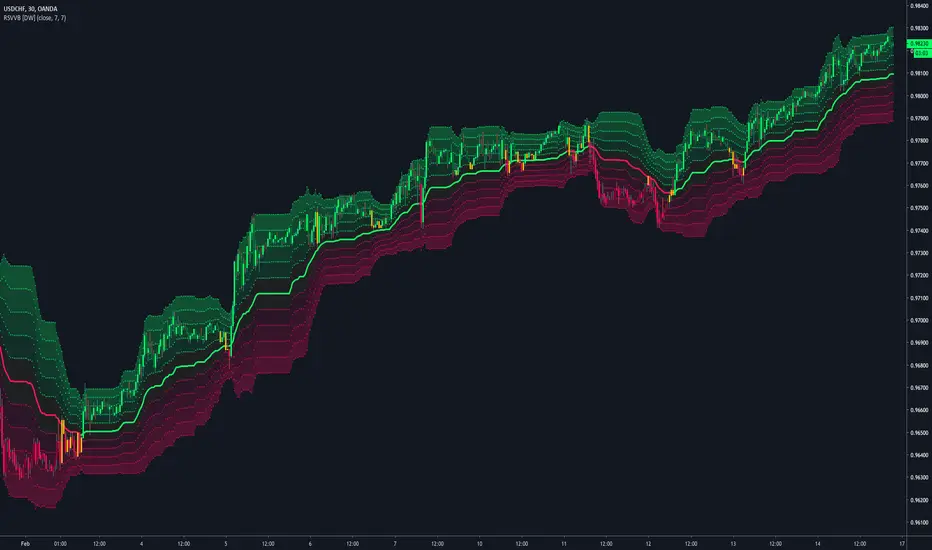
Relative Strength Volatility Variable Bands [DW]This is an experimental adaptive trend following study inspired by Giorgos Siligardos's Reverse Engineering RSI and Tushar S. Chande's Variable Moving Average.
In this study, reverse engineered RSI levels are calculated and used to generate a volatility index for VMA calculation.
First, price levels are calculated for when RSI will equal 70 and 30. The difference between the levels is taken and normalized to create the volatility index.
Next, an initial VMA is calculated using the created volatility index. The moving average is an exponential calculation that adjusts the sampling length as volatility changes.
Then, upper and lower VMAs are calculated by taking a VMA of prices above and below the initial VMA. The midline is produced by taking the median of the upper and lower VMAs.
Lastly, the band levels are calculated by multiplying the distance from the midline to the upper and lower VMAs by 1, 2, 3, 4, and 5.
Bar colors are included. They're based on the midline trend and price action relative to the upper and lower VMAs.
Adaptive StochasticAdapt To The Right Situation
There are already some Adaptive Stochastic scripts out there, but i didn't see the concept of using different periods highest/lowest for their calculations. What we want
for such oscillator is to be active when price is trending and silent during range periods. Like that the information we will see will be clear and easy to use.
Switching between a long term highest/lowest during range periods and a short term highest/lowest during trending periods is what will create the adaptive stochastic.
The switching is made thanks to the Efficiency Ratio , the period of the efficiency ratio is determined by the length parameter.
The period of the highest and lowest will depend on the slow and fast parameters, if our efficiency ratio is close to one (trending market) then the indicator will use highest and lowest of period fast , making the indicator more reactive, if our efficiency ratio is low (ranging market) then the indicator will use highest and lowest of period slow , making the indicator less reactive.
The source of the indicator is a running line ( lsma ) of period slow-fast .
it is also possible to switch the parameters values, making the indicator reactive during ranging market and less reactive during trending ones.
Hope you enjoy
For any questions/demands feel free to pm me, i would be happy to help you

Retention-Acceleration FilterAnother Adaptive Filter
This indicator share the same structure as a classic adaptive filter using an exponential window with a smoothing constant.
However the smoothing constant used is different than any previously made (Kalman Gain, Efficiency ratio, Scaled Fractal Dimension Index) ,
here the smoothing constant is inspired by the different formulations for parameters resolution used in HPLC S. Said (J. High Resolution Chromatograpy &Chromatography Communciations, (1979) 193).
Different assumptions can be made which lead to different expressions for resolution in chromatographic parameters, therefore we will use highest's and lowest's in order to estimate an optimal smoothing constant based on if the market is trending or not. It can be complicated at first but the goal is to provide both smoothness at the right time and a fast estimation of the market center.
Handling Noise
In Red a Pure Sinewave. In White Sinewave + Noise. In Blue our filter of Period 3
Handling stationary signals is not the best thing to do since we need highest's and lowest's and for that non stationary signals with trend + cycle + noise are more suitable.
It is also possible to make it act faster by quiting the pow() function of AltK with sqrt(length) and smoothing the remaining constant.

Range Filter [DW]This is an experimental study designed to filter out minor price action for a clearer view of trends.
Inspired by the QQE's volatility filter, this filter applies the process directly to price rather than to a smoothed RSI.
First, a smooth average price range is calculated for the basis of the filter and multiplied by a specified amount.
Next, the filter is calculated by gating price movements that do not exceed the specified range.
Lastly the target ranges are plotted to display the prices that will trigger filter movement.
Custom bar colors are included. The color scheme is based on the filtered price trend.

Jurik Moving AverageThis indicator was originally developed by Mark Jurik.
NOTE: If Mr. Jurik ask me to remove this indicator from public access then I will do it.

Adaptive Least SquaresAn adaptive filtering technique allowing permanent re-evaluation of the filter parameters according to price volatility. The construction of this filter is based on the formula of moving ordinary least squares or lsma , the period parameter is estimated by dividing the true range with its highest. The filter will react faster during high volatility periods and slower during low volatility ones.
High smooth parameter will create smoother results, values inferior to 3 are recommended.
You can easily replace the parameter estimation method as long as the one used fluctuate in a range of , for example you can use the efficiency ratio
ER = abs(change(close,length))/sum(abs(change(close)),length)
Or the Fractal Dimension Index , in fact any values will work as long as they are rescaled (stoch(value,value,value,length)/100)
For any suggestions/questions feel free to send me a message :)

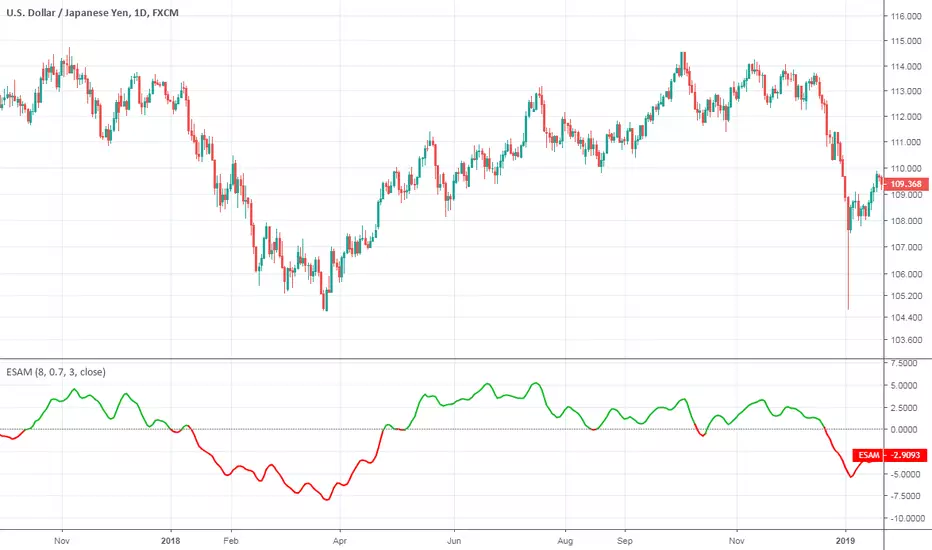
Ehlers Smoothed Adaptive MomentumEhlers Smoothed Adaptive Momentum script.
This indicator was developed and described by John F. Ehlers in his book "Cybernetic Analysis for Stocks and Futures" (2004, Chapter 12: Adapting to the Trend).
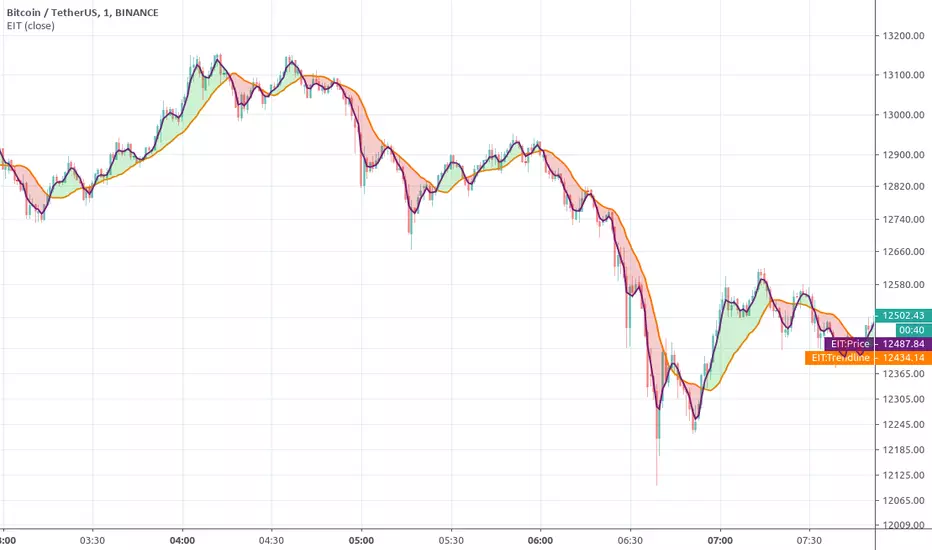
Ehlers Instantaneous TrendlineEhlers Instantaneous Trendline script.
This indicator was described by John F. Ehlers in his book "Rocket Science for Traders" (2001, Chapter 10: The Instantaneous Trendline).
Kaufman Adaptive Moving AverageKaufman Adaptive Moving Average script.
This indicator was originally developed by Perry J. Kaufman (`Smarter Trading: Improving Performance in Changing Markets`, 1995).

Ehlers FilterThis is the Adaptive Ehlers Filter.
I had to unroll the for loops and array because TV is missing crucial data structures and data conversions (Arrays and series to integer conversion for values).
I'm in the process of releasing some scripts. This is a very old script I had. This contains volatility ranges and can be used as trading signals. You can also see how the EF moves up or down, the direction, when price is sideways, and use price breaks up and down as signals from the line.
Have fun, because I didn't making this script hahaha
NOTE : There is an issue with the script where at certain time frames it positions itself below or above. I think its due to calculations. If anyone knows the fix before I get the chance to take a look at it, please let me know.
books.google.com

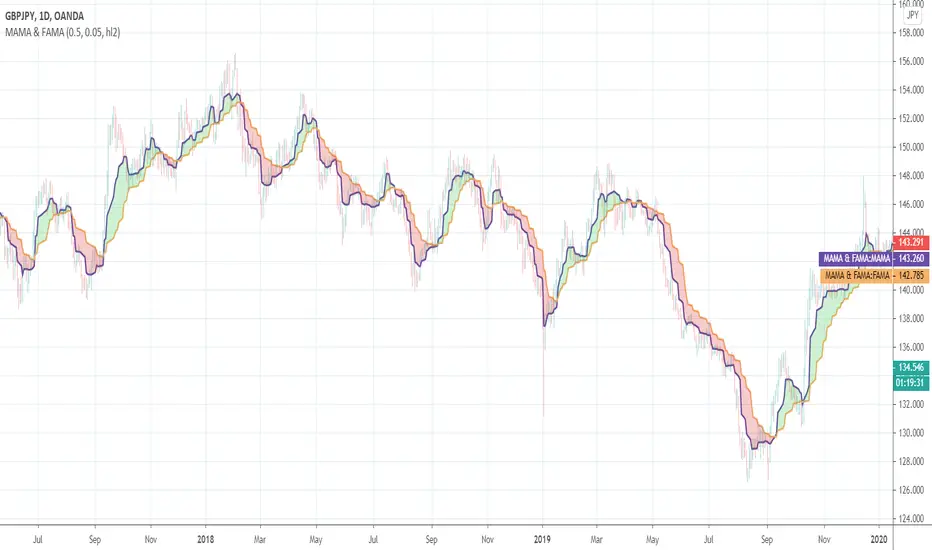
Ehlers MESA Adaptive Moving Averages (MAMA & FAMA)Ehlers MESA Adaptive Moving Averages (MAMA & FAMA) script.
These indicators was originally developed by John F. Ehlers (Stocks & Commodities V. 19:10: MESA Adaptive Moving Averages).
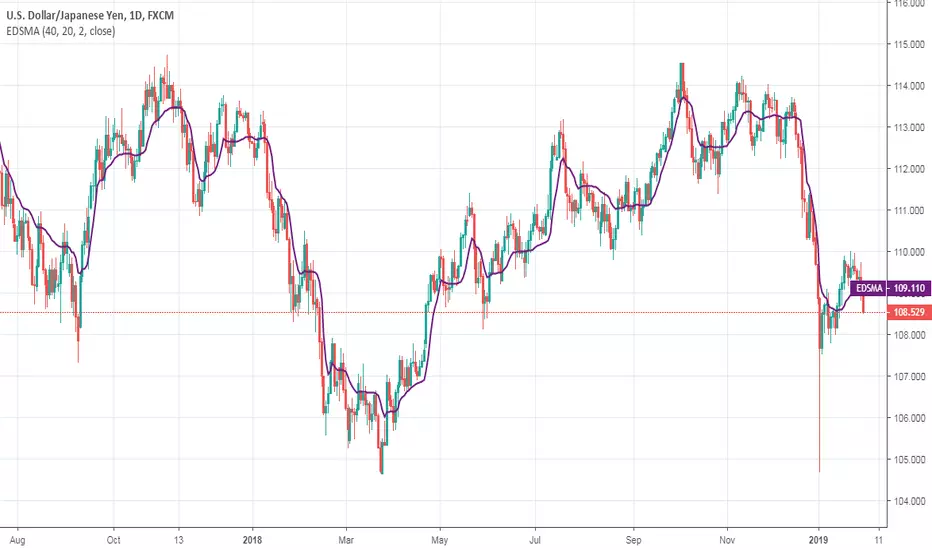
Ehlers Deviation-Scaled Moving Average (DSMA)Ehlers Deviation-Scaled Moving Average indicator script.
This indicator was originally developed by John F. Ehlers (Stocks & Commodities V. 36:8: The Deviation-Scaled Moving Average).
Holt Exponential Moving AverageHolt Exponential Moving Average indicator script.
This indicator was originally developed by Charles C. Holt (International Journal of Forecasting 20(1):5-10, March 2004: Forecasting seasonals and trends by exponentially weighted moving averages).

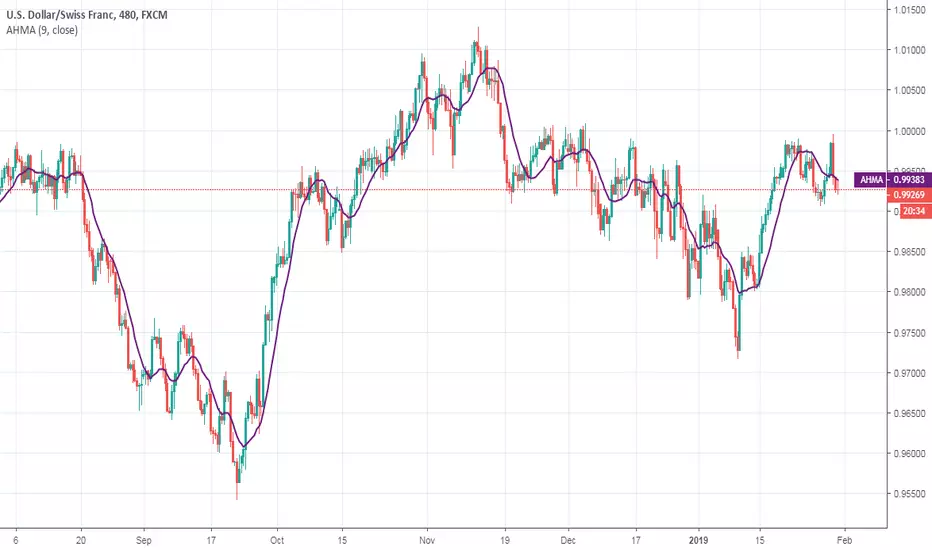
Ahrens Moving AverageAhrens Moving Average indicator script.
This indicator was originally developed by Richard D. Ahrens (Stocks & Commodities V.31:11 (26-30): Build A Better Moving Average).
Adaptive Laguerre FilterAdaptive Laguerre Filter indicator script.
The Adaptive Laguerre Filter was originally developed and described by John Ehlers in his paper `Time Warp – Without Space Travel`.
Thanks to @apozdnyakov for the sorting solution.
