T-Step LSMAIntroduction
The trend step indicator family has produced much interest in the community, those indicators showed in certain cases robustness and reactivity. Their ease of use/interpretation is also a major advantage. Although those indicators have a relatively good fit with the input price, they can still be improved by introducing least-squares fitting on their calculations. This is why i propose a new indicator (T-Step LSMA) which aim to gather all the components of the trend-step indicator family (including the auto-line family).
The indicator will use as a threshold the mean absolute error between the input and the output (T-Channel) scaled with the efficiency ratio (Efficient Trend Step) while using least squares in order to provide a better fit with the price (Auto-Filter).
The Indicator
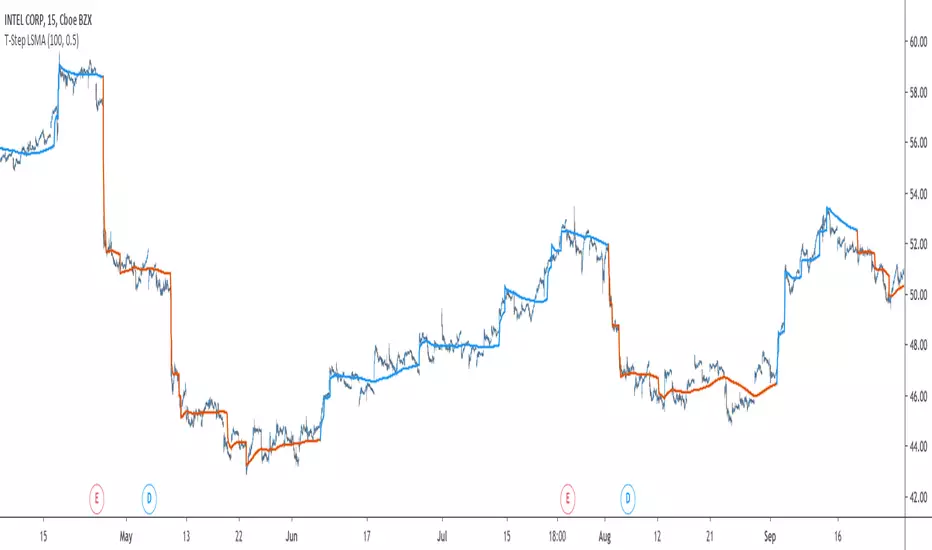
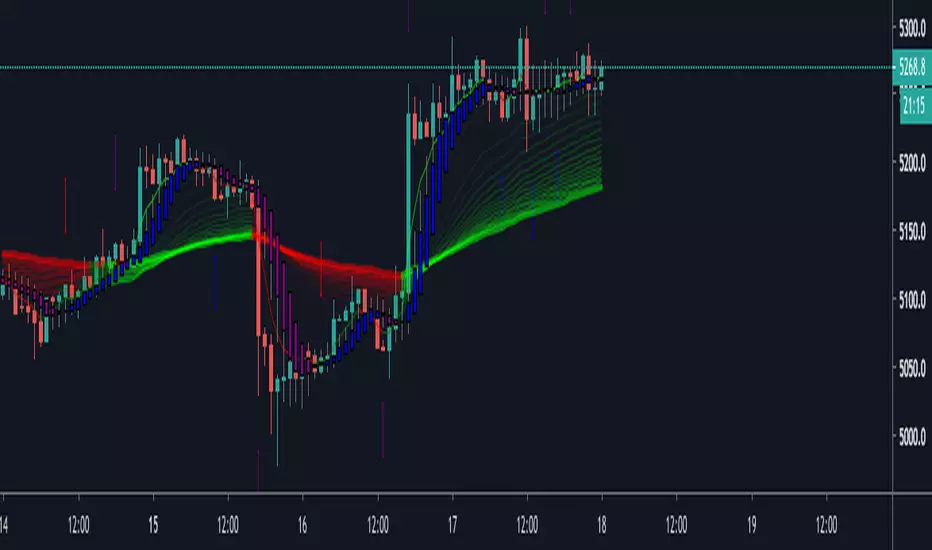
The interpretation of the indicator is easy, the indicator estimate an up-trending market when in blue, down-trending when in orange, the signal only depend on the trend-step part ( b in the code).
length control the period of the efficiency ratio as well as any components in the lsma calculation. The efficiency ratio allow to provide adaptivity, therefore the threshold will be lower when market is trending and higher when market is ranging.
Sc control the amount of feedback of the indicator, a value of 1 will use only the closing price as input, a value of 0.5 will use 50% of the closing price/indicator output as input, this allow to get smoother results.
It is possible to get the non-smooth version of the indicator by checking "No Smoothing".
This allow the indicator to filter more information.
Least Squares Smoothing - Benefits
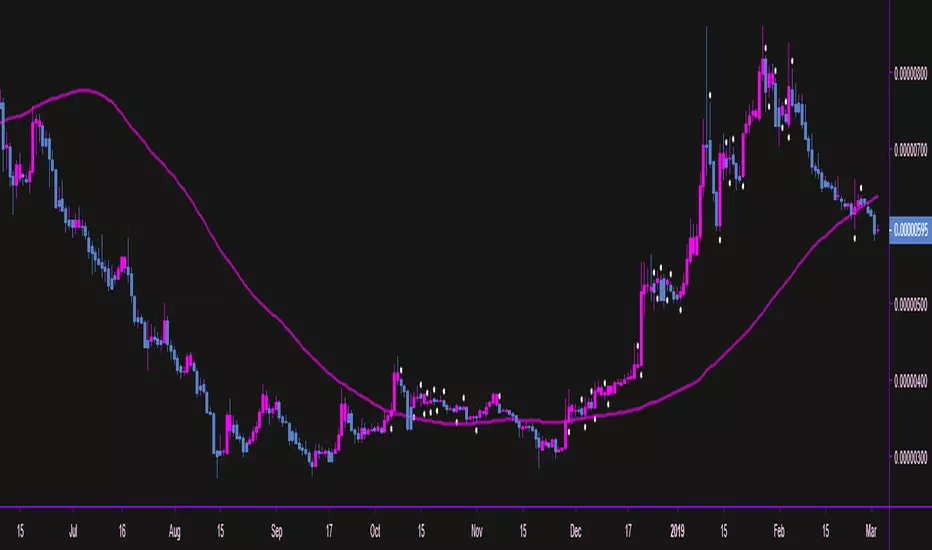
One could ask why introducing least squares smoothing, there are several reasons to this choice, we have seen that trend-step indicators are boxy, they filter most of the variational information in the price, introducing least squares smoothing allow to gain back some of this variational information while providing a better fit with the price, the indicator is more noisy but also more practical in certain situations.
For example the indicator in its boxy form can't really be useful as input for other indicators, which is not the case with this version.
Relative strength index of period 14 using the proposed indicator as input.
Down-Sides
The indicator is dependent on the time frame used, larger time frames resulting in an indicator overfitting, sticking with lower time frames might be ideal. The indicator behavior might also change depending on the market in which it is applied.
Setting Up Alerts For The Indicator
Alerts conditions are already set, in order to create an alert based on the indicator follow these steps :
Go to the alert section (the alarm clock) -> create new alert -> select T-Step LSMA in condition -> Below select Up or Dn (Up for a up-trending alert and Dn for a down-trending alert)
In option select "once per bar close", change the message if you want a personalized message.
Conclusion
I don't think i'll post other indicators related to the trend-step framework for the time to comes, nonetheless the ones posted proven to have interesting results as well as many upsides. Although i don't think they would generate positive long-terms returns they could still be of use when using smarter volatility metrics as threshold. The proposed indicator conserve more information than its relatives and might find some use as input for other indicators.
Recommended Use Of The Code
Although i don't put restrictions on the code usage, i still recommend creative and pertinent changes to be made, graphical changes or any minor changes are not necessary, remember that such practice is disrespectful toward the author, you don't want to load up the tradingview servers for nothing right ?
Support Me
Making indicators sure is hard, it takes time and it can be quite lonely to, so i would love talking with you guys while making them :) There isn't better support than the one provided by your friends so drop me a message.
Alerts
Efficient Trend Step ModThis is my mod of a wonderful script by alexgrover. See his comprehensive description of the logic behind the script at his page at
Added are labels, alerts and selection of periods among (mainly;)) fibo numbers.

Elgrand - MACD crossover overlay with alertVisualize MACD bullish and bearish crossovers on your chart as an overlay. This way you won't necessarily have to add the MACD script and check manually at which point on your chart the MACD crossed. Optionally you can set alerts on the MACD crossovers in case you would like to trade from this after the signal occured.

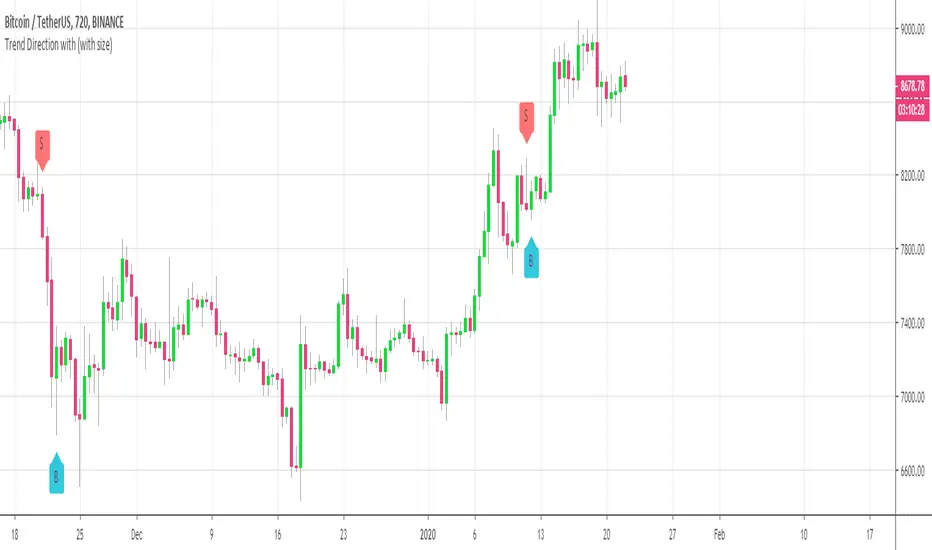
Customizable Trend Direction (Open-Source)Hello everyone
I received a ton of requests for this script so I decided to share it
I did it for a client who didn't want to pay (you can all blame... or even thank him for this script) in the end and I don't want to sell it on my website.
Not because it's not interesting but because my website will be a place to showcase and rent the Algorithm Builders mostly
What is it about?
Basically, it shows how you could convert a plotshape into a label.new object. Very interesting if you want someday to convert your V3 script into V4
With this script, it shows that you can in V4 ( but couldn't do in V3 ) do the followings :
- change dynamically the size (from tiny to huge) of any object
- change dynamically the text (from whatever to whatever) of any object
Screenshot of the user interface
imgur.com
Other use cases
I did it with the Trend Direction but could work with anything really.
- Any indicator with a visual signal. You can know personalized from a user interface the text, size and also the vertical shift. I didn't do it for that one but label.new takes a (x,y) coordinates so playing with y is fairly easy to achieve a dynamic vertical shift
- Even with this script Plotchar-How-to-draw-external-symbols-on-a-chart/ but would require to be updated with a label.new object and with a shape.none parameter so that we'll only see the icon/symbol displayed
- The colors also can be change dynamically using presets Presets-Selector-FRIDAY-NIGHT-CHALLENGE/ . If you have an indicator showing a BULLISH and a BEARISH signal, then you could, for instance, configure colors presets according to the timeframe of the chart or the indicator input, etc (sky is the limit ^^)
Be sure to hit the thumbs up at it motivates me to research what Pinescript can offer and share with the community
Dave
____________________________________________________________
- I'm an officially approved PineEditor/LUA/MT4 approved mentor on codementor. You can request a coaching with me if you want and I'll teach you how to build kick-ass indicators and strategies
Jump on a 1 to 1 coaching with me
- You can also hire for a custom dev of your indicator/strategy/bot/chrome extension/python
Stochastic RSI (with alerts)This is a modification of original Stochastic RSI oscillator, but with addition of highlighted death and golden crosses. It also allows you to receive alerts: "Stochastic RSI: Death cross on 4hours"
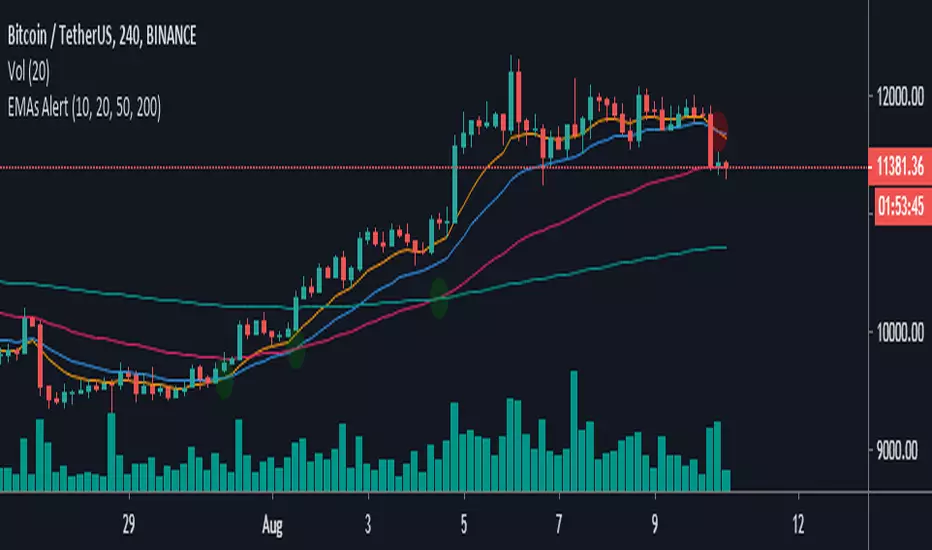
EMAs Alert-This script allows you to show the crossings of the most important emas such as 10, 20, 50 and 200
-You can modify the values of each ema you like
-Bring alerts of the crosses of each ema, which will allow you to activate this function to only the assets you want to track
Adaptive Trailing StopIntroduction
The ability to adapt to possible markets states is important in technical analysis, this is why making adaptive indicator might help get better results. I propose a trailing stop indicator using recursion that can adapt to the efficiency ratio. I have added alerts since it's a often requested feature.
The Indicator
Its quite classical, bands are firstly made then a trailing stop is built around them. The bands are recursive, this allow for faster calculations in general but it also allow for a faster adaptivity. An higher length or factor will make the indicator detect longer term trends, factor determine the raising power of the efficiency ratio.
When smooth is checked the trailing stop will appear smoother.
When adaptive is unchecked the indicator will still act as a trailing stop but might be more affected to ranging markets.
Set a static/trailing stop loss :
You can set your stop loss based on the indicator, a static stop loss can be set at the value of the trailing stop when you enter the market. You can also set it as trailing stop, the indicator will follow the trend thus allowing for potential profits to grow's.
Determine The Trend Direction :
You can generate buy sell signals based on the indicator position relative to the price, when the indicator is lower than the price this indicate a up trending market, when the indicator is higher than the price this indicate a down trending market. If the trailing stop move this indicate a strong current trend.
False signals with trailing stops can happen, the price might go toward the trailing stop making it generate another signal, when market is ranging and exhibiting cyclical behaviour this can affect the indicator and the user might get stuck in a series of false signals, higher length/factor values can fix that at the cost of less early signals.
Identification Of Support And Resistance
Bands during low volatility/ranging markets can return potential reversal points when crossing with the price. The indicator can also do it, even if high/low crosses are better suited to determine support and resistance levels when using a trailing stop. You can use support/resistance identification in conjonction of the current trend detected by the indicator.
Conclusion
The indicator is fully operational in fixed mode while having potential down points in adaptive mode. As you can see the code that return the bands is fully recursive and might provide a great way to create adaptive bands in the future.
I have been asked to give more detail about the indicator uses rather than the construction, i hope the showcased uses are convenient.
Note that the showcased uses can be applied to any trailing stop.
Thanks for reading.

RePaNoCHa V4 [Alerts]Script for automatic trading with Alerts.
LG --> Long (green: not confirmed) (lime: confirmed)
ST --> Short (maroon: not confirmed) (red: confirmed)
TS --> Trailing Stop
xL --> Close Long Position
xS --> Close Short Position
SL --> Stop Loss
The trailing stop closes the trade if the price changes direction by a specified percentage or offset. There is no ideal distance because markets and price are always changing and we know that is impossible to exit on the top or bottom. This script interpolate the trailing Stop Offset with profit, higher profit --> higher Trailing Stop Offset. Despite this, it's difficult to catch the price but not impossible. It has a TS delay too. It take a snapshot every X seconds, if the TS is activated the alert is triggered, otherwise the price keeps fluctuating until a new snapshot.
It can be easily converted to Backtest. Just delete "//" on the corresponding part.
Default settings for XBT:USD at 1H.

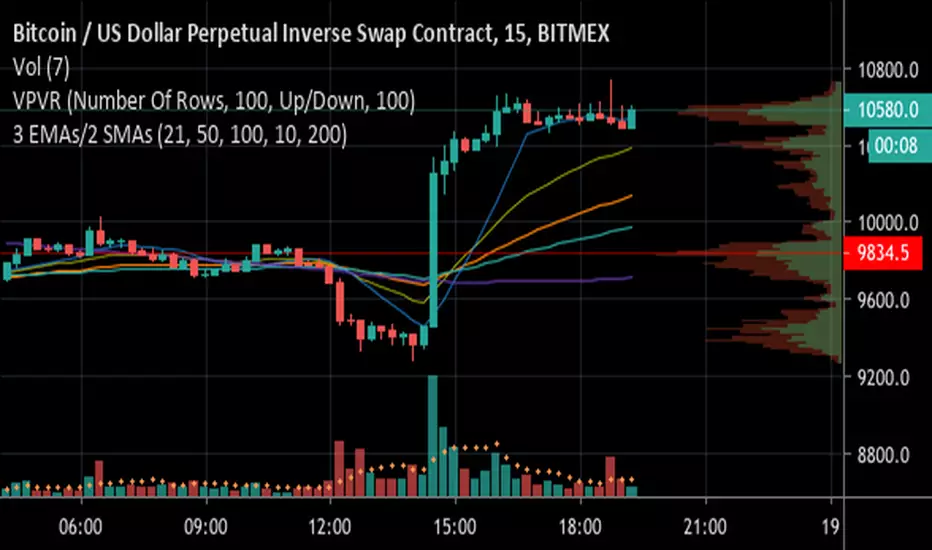
3 EMAs with Crossing Alerts & 2 SMAsHi all,
This is a simple indicator that plots 3 EMA lines and 2MAs of your choice to the screen and has built in alert triggers.
Features:
1) Alerts are triggered when EMAs 1 (Signal line) and 2 (Baseline) cross - a Long signal is called if the cross is above EMA 3 ( Trendline ), a short if the cross is below EMA3
2) Signals are represented visually as a triangle on the chart, below the candles is a long, above is a short
3) TradingView Alerts can be easily set as I have labelled the signals clearly as many other Indicators like this aren’t easy to work out if trying to create alerts to trigger a 3commas bot, for example!
Each EMA is fully customisable and if you wish to take advantage of the alerts, only a few simple rules need to be followed:
EMA1 needs to be less than EMA2.
EMA2 needs to be the same or greater than EMA3
That’s it, happy trading!
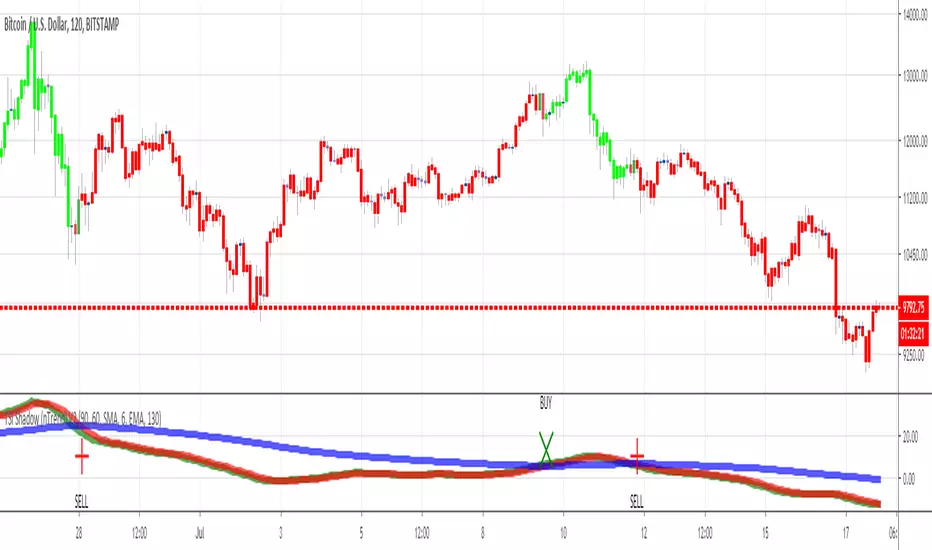
TSI Shadow (with custom candle coloring)Hello traders
This indicator is based on my TSI shadow previously published
This custom version will also color the candles based on the TSI shadow trend
Bullish condition = TSI > MA2 and MA1> MA2
Bearish condition = TSI < MA1 and MA1 < MA2
I made alerts available for this indicator so you can set them on your account
Enjoy
Dave
Brandon BollSecond day at Pinescript and I am attempting to tweak the Bollinger Bands directed strategy to send alerts to Zignaly in order to automate long buy/sells.
I've left in the short script though for completeness.
The buy and sell instructions work perfectly but I don't know how to do a cancel order alert (as included in the original strategy)

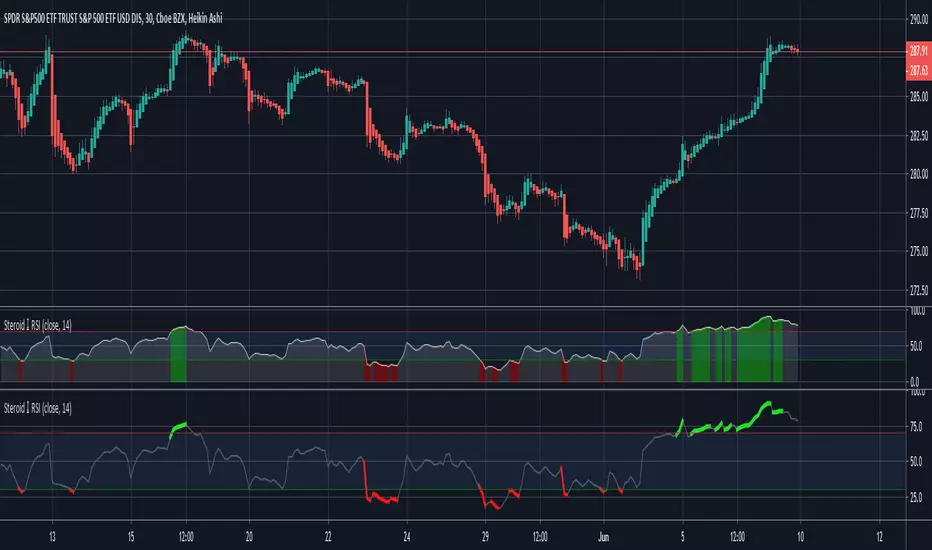
Steroid RSI w/ Overbought & Oversold Alert/@version=2
//By Tantamount
//RSI with overbought and oversold alert features! Highly configurable indicator that includes a Topography map feature, used to detect & easily show threshold crossovers.
//RSI is used to measure the velocity and change of directional price movements. It is very useful to help determine when an asset is reaching an overbought or oversold condition.
//This RSI tool comes loaded with features and is easily configurable back to standard RSI or configure with your own preferences.
Customize to your liking:
Topo map view or standard with highlighted crossover color.
If you like this tool and would like to DONATE/TIP:
Stellar XLM address: GA5XIGA5C7QTPTWXQHY6MCJRMTRZDOSHR6EFIBNDQTCQHG262N4GGKTM
Bitcoin BTC address: 3QwPUnZvAKBXBMU7WMckNgDyfv6PApYduA
BAHbO BB,RSI strategyThis script is using Bollinger Bands in combination with Oversold/Overbought RSI 2(20,80).

Swing Surfing on Slow Heiken AshiGood for Crypto related markets. Guaranteed to catch every big swing, just have to make sure you keep your positions updated. 3m chart.

5 MAs w. alerts [LucF]Is this gazillionth MA indicator worth an addition to the already crowded field of contenders? I say yes! This one shows up to 5 MAs and 6 different marker conditions that can be used to create alerts, among many other goodies.
Features
MAs can be darkened when they are falling.
MAs from another time frame can be displayed, with the option of smoothing them.
Markers can be filtered to Longs or Shorts only.
EMAs can be selected for either all or the two shortest MAs.
The background can be colored using any of the marker states except no. 3.
Markers are:
1. On crosses between any two user-defined MAs,
2. When price is above or below an MA,
3. On Quick Flips (a specific setup involving a cross, multiple MA states and increasing volume, when available),
4. When the difference between two MAs is within a % of its high/low historic values,
5. When an MA has been rising/falling for n bars,
6. When the difference between two MAs is greater than a multiple of ATR.
Some markers use similar visual cues, so distinguishing them will be a challenge if they are used concurrently.
Alerts
Alerts can be created on any combination of alerts. Only non-consecutive instances of markers 5 and 6 will trigger the alert condition. Make sure you are on the interval you want the alert to run at. Using the “Once Per Bar Close” trigger condition is usually the best option.
When an alert is created in TradingView, a snapshot of the indicator’s settings is saved with the alert, which then takes on a life of its own. That is why even though there is only one alert to choose from when you bring up the alert creation dialog box and choose “5 MAs”, that alert can be triggered from any number of conditions. You select those conditions by activating the markers you want the alert to trigger on before creating the alert. If you have selected multiple conditions, then it can be a good idea to record a reminder in the alert’s message field. When the alert triggers, you will need the indicator on the chart to figure out which one of your conditions triggered the alert, as there is currently no way to dynamically change the alert’s message field from within the script.
Background settings will not trigger alerts; only marker configurations.
Notes
MAs are just… averages. Trader lure would have them act as support and resistance levels. I’m not sure about that, and not the only one thinking along these lines. Adam Grimes has studied moving averages in quite a bit of detail. His numbers point to no evidence indicating they act as support/resistance, and to specific MA lengths not being more meaningful than others. His point of view is debated by some—not by me. Mean reversion does not entail that price stops when it reaches its MA; rather, it makes sense to me that price would often more or less oscillate around its MA, which entails the MA does not act as support/resistance. Aren’t the best mean reversion opportunities when price is furthest away from its MA? If so, it should be more profitable to identify these areas, which some of this indicator’s markers try to do.
I think MAs can be much more powerful when thought of as instruments we can use to situate price events in contexts of various resolutions, from the instantaneous to the big picture. Accordingly, I use the relative positions and slopes of MAs in both discretionary and automated trading; but never their purported ability to support/resist.
Regardless of how you use MAs, I hope you will find this indicator useful.
Biased References
The Art and Science of Technical Analysis: Market Structure, Price Action, and Trading Strategies, Adam Grimes, 2012.
Does the 200 day moving average “work”?
Moving averages: digging deeper

SHA & MMAR Strategy Alert IndicatorIndicator w/ alerts for 'Slow-Heiken Ashi & Madrid Moving Average Strategy'.
High win-percentage with cryptocurrencies on a 1H timechart.
Dragon-Bot - Default ScriptDragon-Script is a framework to make it as easy as possible to test your own strategies and set alerts for external execution bots. This is the alerts version of the script.
The script has many features build in, like:
1) A ping/pong mechanism between longs and shorts
2) A stop-loss
3) Trailing Stops with several ways to calculate them.
4) 2 different ways to flip from long to short.
The script is divided into several parts.
The first part of the script is used to set all the variables. You should normally never change the first part except for the comments at the top.
The second part of the script is the part where you initialise all your indicators. Several indicators can be found on Tradingview and on other sites. Please keep in mind that all the variable names used in the indicator should be unique. (all the … = … parts)
The third part of the script, is the most important part of the script. Here you can create the entry and exit points.
Let’s look at the OPENLONG function to explain this part: The first variables are all the possible entries; These are longentry1 till longentry5. You can add many more if you like.
The variables are all initialised as being false. This way the script can set a value to true if an entry happens.
The if function is the actual logic: You could say “if this is true” then (the line below the if function) longentry1 := (becomes) true.
In this case we have said: “if this is true” then (the line below the if function) longentry1 := (becomes) true when the current close is larger than the close that is 1 back.
The last part is the makelong_funct. This part says that if any of the entries are true, the whole function is true.
The last part of the script is the actual execution. Here the alerts are plotted and the back test strategies are opened and closed.
We hope you guys like it and all feedback is welcome!

Dragon Bot - Default ScriptDragon Script is a framework to make it as easy as possible to test your own strategies and set alerts for external execution bots.
The script has many features build in, like:
1) A ping/pong mechanism between longs and shorts
2) A stop-loss
3) Trailing Stops with several ways to calculate them.
4) 2 different ways to flip from long to short.
The script is divided into several parts.
The first part of the script is used to set all the variables. You should normally never change the first part except for the comments at the top.
The second part of the script is the part where you initialise all your indicators. Several indicators can be found on Tradingview and on other sites. Please keep in mind that all the variable names used in the indicator should be unique. (all the … = … parts)
The third part of the script, is the most important part of the script. Here you can create the entry and exit points.
Let’s look at the OPENLONG function to explain this part: The first variables are all the possible entries; These are longentry1 till longentry5. You can add many more if you like.
The variables are all initialised as being false. This way the script can set a value to true if an entry happens.
The if function is the actual logic: You could say “if this is true” then (the line below the if function) longentry1 := (becomes) true.
In this case we have said: “if this is true” then (the line below the if function) longentry1 := (becomes) true when the current close is larger than the close that is 1 back.
The last part is the makelong_funct. This part says that if any of the entries are true, the whole function is true.
The last part of the script is the actual execution. Here the alerts are plotted and the back test strategies are opened and closed.
We hope you guys like it and all feedback is welcome!

Turtles Modified AlertsAlerts for famous Turtle Trading Rules. Based on work from tmr0 and ossettia . It can be used with Autoview.
If you have any advice on how to further improve the script, please let me know by PM or comment below. Thanks!
Please hit on "Like" if you find this script useful so that others can find it easier. Thanks!
*** The information and script provided here are no recommendation to buy or sell. They are just an idea for educational and discussion purposes. ***

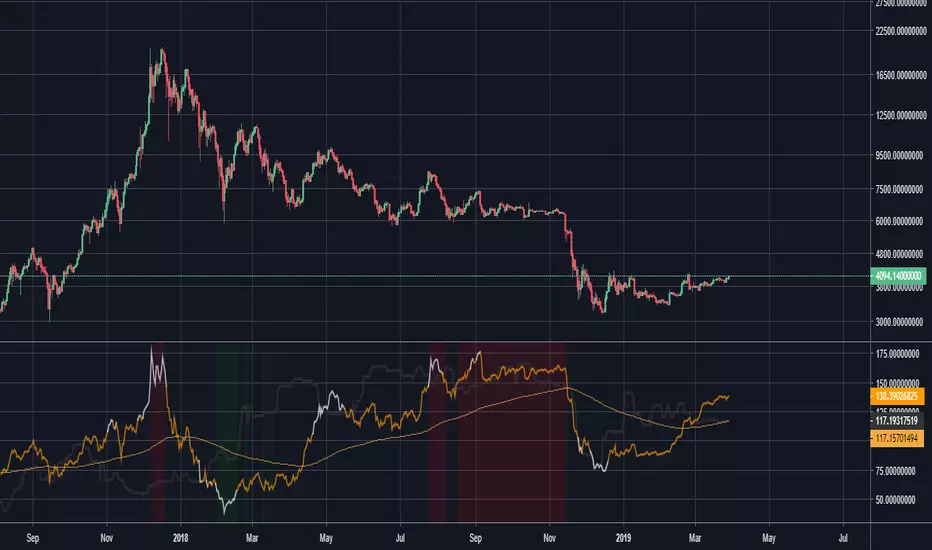
NVT Signal with RMA and thresholds [alertable]NVT Signal, or NVTS, is an indicator that compares the market cap of Bitcoin to the aggregate USD value of daily transactions on the Bitcoin blockchain. It is a value indicator that shows a multiple of Bitcoin price against the actual usage of its blockchain. When the NVTS is low, it suggests Bitcoin price is low relative to the amount of utility the network provides, and vice versa.
For more information on NVTS, visit medium.com
This indicator aims to provide the following:
1. An open-source implementation of NVTS on Tradingview, as the most popular one currently is closed-source.
2. To provide two simple ways to define and visualize "overbought" or "oversold" conditions using the NVTS. Here, we have absolute value of NVTS & deviation from a long-term moving average.
3. Crude integration into Tradingview's alert system.
What this indicator CANNOT do:
1. Timeframes below 1d.
2. Signals based on statistical analyses, such as seen in Bollinger Bands et al. (However, with the appropriate type of account, you can add BBands on top of this indicator.)
I would like to express my gratitude to Willy Woo, Chris Burniske and Dimitry Kalichkin for their work on NVT Ratio and NVT Signal, without which my indicator would not have been created.
Feel free to fork & improve, or experiment with settings. I hope this indicator will be useful to someone.
Up Down Alerts with MA Control - v2.0this update is meant for use with regular candles, but it will mimic the color pattern of heikin ashi candles and allow alerts based on the heikin ashi patterns. Also there are alerts for when the price is above a set moving average.
was going to just update the original script but there are a lot of changes to make it smoother etc, original script:
MACD Enhanced System MTF with optional TSL and Alerts [LTB]This script is developed to analyse MACD, MACD Signal, MACD Histogram movements by using current and higher time frame. Script calculates higher time frame automatically, no manuel entry. there is trailing stop loss line that is optional.
You can change the parameters as you wish.
btw. you should know that MACD is more successful when there is a trend.
I already shared this as a strategy script. Some ppl wanted to see the code.
You might want to see strategy test =>
by LonesomeTheBlue
