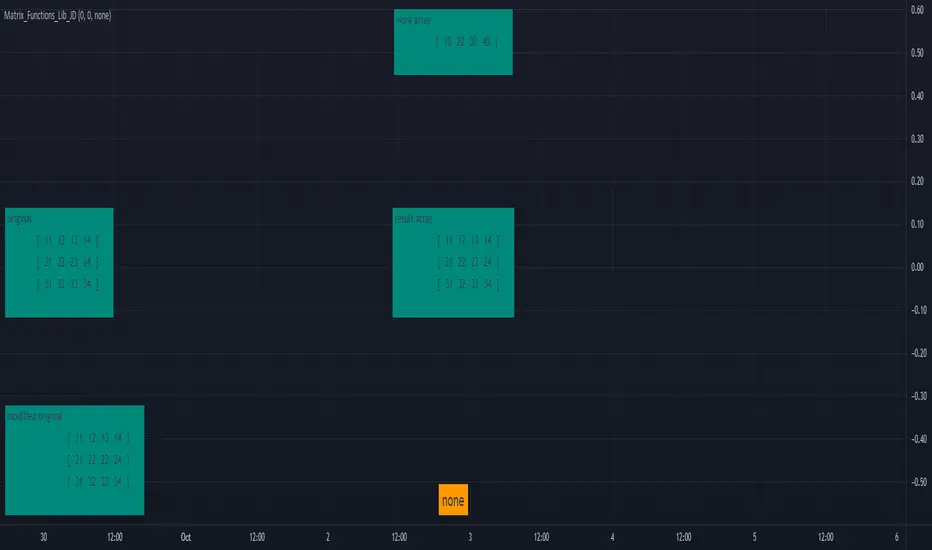
Matrix_Functions_Lib_JDLibrary "Matrix_Functions_Lib_JD"
This is a library to add matrix / 2D array functionality to Pinescript.
once you import the library at the beginning of your script, you can add all the functions described below just by calling them like you do any other built'in function.
Enjoy,
Gr, JD.
PS. if you find functionality or calculation errors in the functions, please let me know, so I can fix them.
There are quite a lot of functions, so little mishaps may have slipped in! ;-)
get_nr_of_rows() Returns the number of rows from a 2D matrix
get_nr_of_columns() Returns the number of columns from a 2D matrix
get_size() Returns a tuple with the total number of rows and columns from a 2D matrix
init() 2D matrix init function, builds a 2D matrix with dimensional metadata in first two values and fills it with a default value, the body of the actual matrix data starts at index 2.
from_list() 2D matrix init function, builds a 2D matrix from an existing array by adding dimensional metadata in first two values, the body of the actual matrix data consists of the data of the source array and starts at index 2.
set() Sets values in 2D matrix with (row index, column index) (index for rows and columns both starts at 0 !!)
fill_val() Fills all elements in a 2D matrix with a value
randomize() Fills a 2D matrix with random values//
get() Gets values from 2D matrix with (row index, column index) (index for rows and columns both starts at 0 !!)
copy_slice_body() Cuts off the metadata header and returns the array body, WITHOUT THE DIMENSIONAL METADATA!!
do_slice This variable should be set as: - 'false' to only make a copy, changes to the new array copy will NOT ALTER the ORIGINAL - 'true' to make a slice, changes to the new array slice WILL(!) ALTER the ORIGINAL
get_record() Gets /retrieve the values from a ROW/RECORD from a certain row/lookback period, the values are returned as an array
get_row_index() Gets the row nr. in a 2D matrix from 1D index (index for rows and columns both starts at 0 !!)
get_column_index() Gets the column nr. in a 2D matrix from 1D index (index for rows and columns both starts at 0 !!)
get_row_column_index() Gets a tuple with the (row, column) coordinates in 2D matrix from 1D index (index starts at 0 and does not include the header!!)
get_array_index() Gets the 1D index from (row, column) coordinates in 2D matrix (index for row and column both starts at 0 !! Index starts at 0 and does not include the header!!)
remove_rows() Removes one or more rows/records from a 2D matrix (if from_row = to_row, only this row is removed)
remove_columns() Remove one or more columns from a 2D matrix (if from_column = to_column, only this column is removed)
insert_array_of_rows() Insert an array of rows/records at a certain row number in a 2D matrix
add_row() ADDS a ROW/RECORD on the TOP of a sheet, shift the whole list one down and gives the option to REMOVE the OLDEST row/record. (2D version of "unshift" + "pop" but with a whole row at once)
insert_array_of_columns() Insert an array of columns at a certain column number in a 2D matrix
append_array_of_rows() Appends/adds an array of rows/records to the bottom of a 2D matrix
append_array_of_columns() Appends/adds an array of columns to the right side of a 2D matrix
pop_row() Removes / pops and returns the last row/record from a 2D matrix.
pop_column() Removes / pops and returns the last (most right) column from a 2D matrix.
replace()
abs()
add_value() Returns a new matrix with the same value added to all the elements of the source matrix.
addition() Returns a new matrix with the of the elements of one 2D matrix added to every corresponding element of a source 2D matrix.
subtract_value() Returns a new matrix with the same value subtracted from every element of a 2D matrix
subtraction() Returns a new matrix with the values of the elements of one 2D matrix subtracted from every corresponding element of a source 2D matrix.
scalar_multipy() Returns a new matrix with all the elements of the source matrix scaled/multiplied by a scalar value.
transpose() Returns a new matrix with the elements of the source matrix transposed.
multiply_elem() Performs ELEMENT WISE MULTIPLICATION of 2D matrices, returns a new matrix c.
multiply() Performs DOT PROCUCT MULTIPLICATION of 2D matrices, returns a new matrix c.
determinant_2x2() Calculates the determinant of 2x2 matrices.
determinant_3x3() Calculates the determinant of 3x3 matrices.
determinant_4x4() Calculates the determinant of 4x4 matrices.
print() displays a 2D matrix in a table layout.
Arrays
Hx MTF Sorted MAs Panel with Freeze WarningThis script displays the close price and 4 sorted moving averages of your choice in a small repositionable panel and, when used on a higher timeframe, warns you when values may be different from actual values in the higher timeframe, inciting you to double check the actual values of the moving averages in the higher timeframe the panel is supposed to reflect.
The 4 moving averages and close are sorted together, providing you with a bird’s-eye view of their relative positions, the same way moving averages and last price values are displayed on the right scale.
The black header reminds of:
(1) the timeframe (resolution) used in the panel
(2) the remaining time before a new bar is created in the panel timeframe. Note that this remaining time is different from the one on the right scale, since it is only updated when a new transaction occurs.
Below, price and moving averages are sorted, color coded and followed by:
(1) a trend indicator ↗ or ↘ meaning that last change is up or down
(2) the number of bars since the moving average is above or below close (0 means current bar). This is obviously not displayed after the close price line (white background color).
Use
This panel was basically developed to display higher timeframe data but it can also be used with the same timeframe as chart for example if you do not want to plot moving averages on your chart but are still interested in their trends and relative positions vs price.
If you see something strange (like header is not black and displays NaN), it just means you requested moving averages that are not available in the panel timeframe. This may happen with newly introduced cryptos and “long” MA timeframes.
Different Timeframe
If you choose to use the panel on a different timeframe than the current one, be aware that you should only use timeframes higher than the current one, as per Tradingview recommendations.
If you select a lower timeframe than the current one, the panel timeframe header cell will turn to the alert color you set (fuchsia by default).
After tinkering for a while with the security function, I noticed that sometimes indicator values “freeze” (i.e. stop udating) and I have found no workaround.
What I mean is that when you look at a sma on a 5 minutes timeframe (the reference) and look at this same sma on a 5 minutes timeframe but from a lower timeframe through the security function set with a timeframe of 5 minutes, values returned by the security function are not always up to date and “freeze”. That’s the bad news.
Freeze warning
The better news is that this unexpected behaviour seems to be predictable, at least on minutes timeframes and I implemented an indicator that endeavors to detecting such situations. When the panel believes data may be frozen, the ‘Remaining Time’ header cell will turn to the alert color.
This feature is only implemented on minutes timeframes and can be switched on or off.
Other points of interest in this script
If you code, this function may also interest you:
sortWithIndexes (arrayToSort) returns a tuple (sortedArray, sortedIndexes) and therefore allows multi-dimensional arrays sorting without actually implementing a sorting algorithm 😉.
Default Settings
The default settings provide an example of commonly used moving averages with associated colors ranked from Hot (more nervous) to Cold (less nervous).
These settings are just an example and are NOT meant to be used as a trading system! DYOR!
Hope it will be useful.
Does the Freeze warning work for you? What do you think of my pseudo sorting algorithm?
Enjoy and please let me know what you think in the comments.

2 Dimensional Array using one floating point entry This is an attempt to create a two dimensional floating point array from the pine single dimension array.
It enables some useful array functions like sorting, when you are trying to keep track of price and location in time or bars and you would like to sort the array.
Other array functions on this array will not work, like average and other statistical functions - they will provide bad results. I would suggest continuing to use a single dimensional array for each element where that kind of array function is required.
I wrote this simply as a mean of using the sort functions when I had to sort price and try to keep the bar location or time in synch.
Other array functions could be written to manipulate this kind of array, leave that to others. The goal here was to avoid using for loops which would be a performance impact on large arrays.
The basic concept is to create one floating point number from two, put that into an array, and then be able to pull the compound value out and parse out the individual components.
I imagine it could also accommodate a 3 or 4 dimensional array with some work, as long as you had some idea of how many digits are consumed by each element. For example you may be interested in storing price, RSI, x_loc values and then be able to sort and parse them out.
Pinescript - Common Label & Line Array Functions Library by RRBPinescript - Common Label & Line Array Functions Library by RagingRocketBull 2021
Version 1.0
This script provides a library of common array functions for arrays of label and line objects with live testing of all functions.
Using this library you can easily create, update, delete, join label/line object arrays, and get/set properties of individual label/line object array items.
You can find the full list of supported label/line array functions below.
There are several libraries:
- Common String Functions Library
- Standard Array Functions Library
- Common Fixed Type Array Functions Library
- Common Label & Line Array Functions Library
- Common Variable Type Array Functions Library
Features:
- 30 array functions in categories create/update/delete/join/get/set with support for both label/line objects (45+ including all implementations)
- Create, Update label/line object arrays from list/array params
- GET/SET properties of individual label/line array items by index
- Join label/line objects/arrays into a single string for output
- Supports User Input of x,y coords of 5 different types: abs/rel/rel%/inc/inc% list/array, auto transforms x,y input into list/array based on type, base and xloc, translates rel into abs bar indexes
- Supports User Input of lists with shortened names of string properties, auto expands all standard string properties to their full names for use in functions
- Live Output for all/selected functions based on User Input. Test any function for possible errors you may encounter before using in script.
- Output filters: hide all excluded and show only allowed functions using a list of function names
- Output Panel customization options: set custom style, color, text size, and line spacing
Usage:
- select create function - create label/line arrays from lists or arrays (optional). Doesn't affect the update functions. The only change in output should be function name regardless of the selected implementation.
- specify num_objects for both label/line arrays (default is 7)
- specify common anchor point settings x,y base/type for both label/line arrays and GET/SET items in Common Settings
- fill lists with items to use as inputs for create label/line array functions in Create Label/Line Arrays section
- specify label/line array item index and properties to SET in corresponding sections
- select label/line SET function to see the changes applied live
Code Structure:
- translate x,y depending on x,y type, base and xloc as specified in UI (required for all functions)
- expand all shortened standard property names to full names (required for create/update* from arrays and set* functions, not needed for create/update* from lists) to prevent errors in label.new and line.new
- create param arrays from string lists (required for create/update* from arrays and set* functions, not needed for create/update* from lists)
- create label/line array from string lists (property names are auto expanded) or param arrays (requires already expanded properties)
- update entire label/line array or
- get/set label/line array item properties by index
Transforming/Expanding Input values:
- for this script to work on any chart regardless of price/scale, all x*,y* are specified as % increase relative to x0,y0 base levels by default, but user can enter abs x,price values specific for that chart if necessary.
- all lists can be empty, contain 1 or several items, have the same/different lengths. Array Length = min(min(len(list*)), mum_objects) is used to create label/line objects. Missing list items are replaced with default property values.
- when a list contains only 1 item it is duplicated (label name/tooltip is also auto incremented) to match the calculated Array Length
- since this script processes user input, all x,y values must be translated to abs bar indexes before passing them to functions. Your script may provide all data internally and doesn't require this step.
- at first int x, float y arrays are created from user string lists, transformed as described below and returned as x,y arrays.
- translated x,y arrays can then be passed to create from arrays function or can be converted back to x,y string lists for the create from lists function if necessary.
- all translation logic is separated from create/update/set functions for the following reasons:
- to avoid redundant code/dependency on ext functions/reduce local scopes and to be able to translate everything only once in one place - should be faster
- to simplify internal logic of all functions
- because your script may provide all data internally without user input and won't need the translation step
- there are 5 types available for both x,y: abs, rel, rel%, inc, inc%. In addition to that, x can be: bar index or time, y is always price.
- abs - absolute bar index/time from start bar0 (x) or price (y) from 0, is >= 0
- rel - relative bar index/time from cur bar n (x) or price from y0 base level, is >= 0
- rel% - relative % increase of bar index/time (x) or price (y) from corresponding base level (x0 or y0), can be <=> 0
- inc - relative increment (step) for each new level of bar index/time (x) or price (y) from corresponding base level (x0 or y0), can be <=> 0
- inc% - relative % increment (% step) for each new level of bar index/time (x) or price (y) from corresponding base level (x0 or y0), can be <=> 0
- x base level >= 0
- y base level can be 0 (empty) or open, close, high, low of cur bar
- single item x1_list = "50" translates into:
- for x type abs: "50, 50, 50 ..." num_objects times regardless of xloc => x = 50
- for x type rel: "50, 50, 50 ... " num_objects times => x = x_base + 50
- for x type rel%: "50%, 50%, 50% ... " num_objects times => x_base * (1 + 0.5)
- for x type inc: "0, 50, 100 ... " num_objects times => x_base + 50 * i
- for x type inc%: "0%, 50%, 100% ... " num_objects times => x_base * (1 + 0.5 * i)
- when xloc = xloc.bar_index each rel*/inc* value in the above list is then subtracted from n: n - x to convert rel to abs bar index, values of abs type are not affected
- x1_list = "0, 50, 100, ..." of type rel is the same as "50" of type inc
- x1_list = "50, 50, 50, ..." of type abs/rel/rel% produces a sequence of the same values and can be shortened to just "50"
- single item y1_list = "2" translates into (ragardless of yloc):
- for y type abs: "2, 2, 2 ..." num_objects times => y = 2
- for y type rel: "2, 2, 2 ... " num_objects times => y = y_base + 2
- for y type rel%: "2%, 2%, 2% ... " num_objects times => y = y_base * (1 + 0.02)
- for y type inc: "0, 2, 4 ... " num_objects times => y = y_base + 2 * i
- for y type inc%: "0%, 2%, 4% ... " num_objects times => y = y_base * (1 + 0.02 * i)
- when yloc != yloc.price all calculated values above are simply ignored
- y1_list = "0, 2, 4" of type rel% is the same as "2" with type inc%
- y1_list = "2, 2, 2" of type abs/rel/rel% produces a sequence of the same values and can be shortened to just "2"
- you can enter shortened property names in lists. To lookup supported shortened names use corresponding dropdowns in Set Label/Line Array Item Properties sections
- all shortened standard property names must be expanded to full names (required for create/update* from arrays and set* functions, not needed for create/update* from lists) to prevent errors in label.new and line.new
- examples of shortened property names that can be used in lists: bar_index, large, solid, label_right, white, left, left, price
- expanded to their corresponding full names: xloc.bar_index, size.large, line.style_solid, label.style_label_right, color.white, text.align_left, extend.left, yloc.price
- all expanding logic is separated from create/update* from arrays and set* functions for the same reasons as above, and because param arrays already have different types, implying the use of final values.
- all expanding logic is included in the create/update* from lists functions because it seemed more natural to process string lists from user input directly inside the function, since they are already strings.
Creating Label/Line Objects:
- use study max_lines_count and max_labels_count params to increase the max number of label/line objects to 500 (+3) if necessary. Default number of label/line objects is 50 (+3)
- all functions use standard param sequence from methods in reference, except style always comes before colors.
- standard label/line.get* functions only return a few properties, you can't read style, color, width etc.
- label.new(na, na, "") will still create a label with x = n-301, y = NaN, text = "" because max default scope for a var is 300 bars back.
- there are 2 types of color na, label color requires color(na) instead of color_na to prevent error. text_color and line_color can be color_na
- for line to be visible both x1, x2 ends must be visible on screen, also when y1 == y2 => abs(x1 - x2) >= 2 bars => line is visible
- xloc.bar_index line uses abs x1, x2 indexes and can only be within 0 and n ends, where n <= 5000 bars (free accounts) or 10000 bars (paid accounts) limit, can't be plotted into the future
- xloc.bar_time line uses abs x1, x2 times, can't go past bar0 time but can continue past cur bar time into the future, doesn't have a length limit in bars.
- xloc.bar_time line with length = exact number of bars can be plotted only within bar0 and cur bar, can't be plotted into the future reliably because of future gaps due to sessions on some charts
- xloc.bar_index line can't be created on bar 0 with fixed length value because there's only 1 bar of horiz length
- it can be created on cur bar using fixed length x < n <= 5000 or
- created on bar0 using na and then assigned final x* values on cur bar using set_x*
- created on bar0 using n - fixed_length x and then updated on cur bar using set_x*, where n <= 5000
- default orientation of lines (for style_arrow* and extend) is from left to right (from bar 50 to bar 0), it reverses when x1 and x2 are swapped
- price is a function, not a line object property
Variable Type Arrays:
- you can't create an if/function that returns var type value/array - compiler uses strict types and doesn't allow that
- however you can assign array of any type to another array of any type creating an arr pointer of invalid type that must be reassigned to a matching array type before used in any expression to prevent error
- create_any_array2 uses this loophole to return an int_arr pointer of a var type array
- this works for all array types defined with/without var keyword and doesn't work for string arrays defined with var keyword for some reason
- you can't do this with var type vars, only var type arrays because arrays are pointers passed by reference, while vars are actual values passed by value.
- you can only pass a var type value/array param to a function if all functions inside support every type - otherwise error
- alternatively values of every type must be passed simultaneously and processed separately by corresponding if branches/functions supporting these particular types returning a common single type result
- get_var_types solves this problem by generating a list of dummy values of every possible type including the source type, tricking the compiler into allowing a single valid branch to execute without error, while ignoring all dummy results
Notes:
- uses Pinescript v3 Compatibility Framework
- uses Common String Functions Library, Common Fixed Type Array Functions Library, Common Variable Type Array Functions Library
- has to be a separate script to reduce the number of local scopes/compiled file size, can't be merged with another library.
- lets you live test all label/line array functions for errors. If you see an error - change params in UI
- if you see "Loop too long" error - hide/unhide or reattach the script
- if you see "Chart references too many candles" error - change x type or value between abs/rel*. This can happen on charts with 5000+ bars when a rel bar index x is passed to label.new or line.new instead of abs bar index n - x
- create/update_label/line_array* use string lists, while create/update_label/line_array_from_arrays* use array params to create label/line arrays. "from_lists" is dropped to shorten the names of the most commonly used functions.
- create_label/line_array2,4 are preferable, 5,6 are listed for pure demonstration purposes only - don't use them, they don't improve anything but dramatically increase local scopes/compiled file size
- for this reason you would mainly be using create/update_label/line_array2,4 for list params or create/update_label/line_array_from_arrays2 for array params
- all update functions are executed after each create as proof of work and can be disabled. Only create functions are required. Use update functions when necessary - when list/array params are changed by your script.
- both lists and array item properties use the same x,y_type, x,y_base from common settings
- doesn't use pagination, a single str contains all output
- why is this so complicated? What are all these functions for?
- this script merges standard label/line object methods with standard array functions to create a powerful set of label/line object array functions to simplify manipulation of these arrays.
- this library also extends the functionality of Common Variable Type Array Functions Library providing support for label/line types in var type array functions (any_to_str6, join_any_array5)
- creating arrays from either lists or arrays adds a level of flexibility that comes with complexity. It's very likely that in your script you'd have to deal with both string lists as input, and arrays internally, once everything is converted.
- processing user input, allowing customization and targeting for any chart adds a whole new layer of complexity, all inputs must be translated and expanded before used in functions.
- different function implementations can increase/reduce local scopes and compiled file size. Select a version that best suits your needs. Creating complex scripts often requires rewriting your code multiple times to fit the limits, every line matters.
P.S. Don't rely too much on labels, for too often they are fables.
List of functions*:
* - functions from other libraries are not listed
1. Join Functions
Labels
- join_label_object(label_, d1, d2)
- join_label_array(arr, d1, d2)
- join_label_array2(arr, d1, d2, d3)
Lines
- join_line_object(line_, d1, d2)
- join_line_array(arr, d1, d2)
- join_line_array2(arr, d1, d2, d3)
Any Type
- any_to_str6(arr, index, type)
- join_any_array4(arr, d1, d2, type)
- join_any_array5(arr, d, type)
2. GET/SET Functions
Labels
- label_array_get_text(arr, index)
- label_array_get_xy(arr, index)
- label_array_get_fields(arr, index)
- label_array_set_text(arr, index, str)
- label_array_set_xy(arr, index, x, y)
- label_array_set_fields(arr, index, x, y, str)
- label_array_set_all_fields(arr, index, x, y, str, xloc, yloc, label_style, label_color, text_color, text_size, text_align, tooltip)
- label_array_set_all_fields2(arr, index, x, y, str, xloc, yloc, label_style, label_color, text_color, text_size, text_align, tooltip)
Lines
- line_array_get_price(arr, index, bar)
- line_array_get_xy(arr, index)
- line_array_get_fields(arr, index)
- line_array_set_text(arr, index, width)
- line_array_set_xy(arr, index, x1, y1, x2, y2)
- line_array_set_fields(arr, index, x1, y1, x2, y2, width)
- line_array_set_all_fields(arr, index, x1, y1, x2, y2, xloc, extend, line_style, line_color, width)
- line_array_set_all_fields2(arr, index, x1, y1, x2, y2, xloc, extend, line_style, line_color, width)
3. Create/Update/Delete Functions
Labels
- delete_label_array(label_arr)
- create_label_array(list1, list2, list3, list4, list5, d)
- create_label_array2(x_list, y_list, str_list, xloc_list, yloc_list, style_list, color1_list, color2_list, size_list, align_list, tooltip_list, d)
- create_label_array3(x_list, y_list, str_list, xloc_list, yloc_list, style_list, color1_list, color2_list, size_list, align_list, tooltip_list, d)
- create_label_array4(x_list, y_list, str_list, xloc_list, yloc_list, style_list, color1_list, color2_list, size_list, align_list, tooltip_list, d)
- create_label_array5(x_list, y_list, str_list, xloc_list, yloc_list, style_list, color1_list, color2_list, size_list, align_list, tooltip_list, d)
- create_label_array6(x_list, y_list, str_list, xloc_list, yloc_list, style_list, color1_list, color2_list, size_list, align_list, tooltip_list, d)
- update_label_array2(label_arr, x_list, y_list, str_list, xloc_list, yloc_list, style_list, color1_list, color2_list, size_list, align_list, tooltip_list, d)
- update_label_array4(label_arr, x_list, y_list, str_list, xloc_list, yloc_list, style_list, color1_list, color2_list, size_list, align_list, tooltip_list, d)
- create_label_array_from_arrays2(x_arr, y_arr, str_arr, xloc_arr, yloc_arr, style_arr, color1_arr, color2_arr, size_arr, align_arr, tooltip_arr, d)
- create_label_array_from_arrays4(x_arr, y_arr, str_arr, xloc_arr, yloc_arr, style_arr, color1_arr, color2_arr, size_arr, align_arr, tooltip_arr, d)
- update_label_array_from_arrays2(label_arr, x_arr, y_arr, str_arr, xloc_arr, yloc_arr, style_arr, color1_arr, color2_arr, size_arr, align_arr, tooltip_arr, d)
Lines
- delete_line_array(line_arr)
- create_line_array(list1, list2, list3, list4, list5, list6, d)
- create_line_array2(x1_list, y1_list, x2_list, y2_list, xloc_list, extend_list, style_list, color_list, width_list, d)
- create_line_array3(x1_list, y1_list, x2_list, y2_list, xloc_list, extend_list, style_list, color_list, width_list, d)
- create_line_array4(x1_list, y1_list, x2_list, y2_list, xloc_list, extend_list, style_list, color_list, width_list, d)
- create_line_array5(x1_list, y1_list, x2_list, y2_list, xloc_list, extend_list, style_list, color_list, width_list, d)
- create_line_array6(x1_list, y1_list, x2_list, y2_list, xloc_list, extend_list, style_list, color_list, width_list, d)
- update_line_array2(line_arr, x1_list, y1_list, x2_list, y2_list, xloc_list, extend_list, style_list, color_list, width_list, d)
- update_line_array4(line_arr, x1_list, y1_list, x2_list, y2_list, xloc_list, extend_list, style_list, color_list, width_list, d)
- create_line_array_from_arrays2(x1_arr, y1_arr, x2_arr, y2_arr, xloc_arr, extend_arr, style_arr, color_arr, width_arr, d)
- update_line_array_from_arrays2(line_arr, x1_arr, y1_arr, x2_arr, y2_arr, xloc_arr, extend_arr, style_arr, color_arr, width_arr, d)

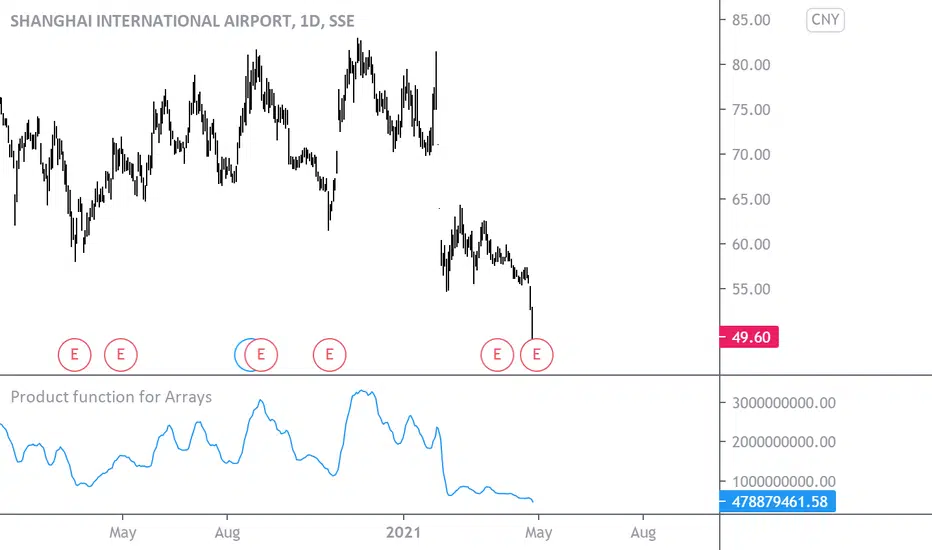
Product function for ArraysHello,
This code may be useful for Pine script coders only.
Arrays were welcomed in Pine script, as they are a foundation for coding properly many useful things, like studies and strategies here in TradingView :)
TradingView recently released new functions for arrays, like array.median and more, but the "PRODUCT" function was still missing, so I created it. I've no doubt that array.product() will soon be proposed by the platform, but for the time being, one can use mine.
It does the same thing as the PRODUCT() function in Excel : it multiplies all the source values included in the specified lookback, and returns the product. This function can accept Series or Arrays as source input.
Tick Data DetailedHello All,
After Tick Chart and Tick Chart RSI scripts, this is Tick Data Detailed script. Like other tick scrips this one only works on real-time bars too. it creates two tables: the table at the right shows the detailed data for Current Bar and the table at the left shows the detailed data for all calculated bars (cumulative). the script checks the volume on each tick and add the tick and volume to the specified level (you can set/change levels)
The volume is multiplied by close price to calculate real volume .There are 7 levels/zones and the default levels are:
0 - 10.000
10.000 - 20.000
20.000 - 50.000
50.000 - 100.000
100.000 - 200.000
200.000 - 400.000
> 400.000
With this info, you will get number of ticks and total volumes on each levels. The idea to separate this levels is in order to know which type of traders trade at that moment. for example volume of whale moves are probably greater than 400.000 or at least 100.000. Or volume of small traders is less than 10.000 or between 20.000-50.000.
You will get info if there is anomaly on each candle as well. what is anomaly definition? Current candle is green but Sell volume is greater than Buy volume or current candle is red but Buy volume is greater than Sell volume . it is shown as (!). you should think/search why/how this anomaly occurs. You can see screenshot about it below.
also "TOTAL" text color changes automatically. if Buy volume is greater than Sell volume then its color becomes Green, if Sell volume is greater than Buy volume then its color becomes Red (or any color you set)
Optionally you can change background and text colors as shown in the example below.
Explanation:
How anomaly is shown:
You can enable coloring background and set the colors as you wish:
And Thanks to @Duyck for letting me use the special characters from his great script.
Enjoy!

Pinescript - Standard Array Functions Library by RRBStandard Array Functions Library by RagingRocketBull 2021
Version 1.0
This script provides a library of every standard Pinescript array function for live testing with all supported array types.
You can find the full list of supported standard array functions below.
There are several libraries:
- Common String Functions Library
- Common Array Functions Library
- Standard Array Functions Library
Features:
- Supports all standard array functions (30+) with all possible array types* (* - except array.new* functions and label, line array types)
- Live Output for all/selected functions based on User Input. Test any function for possible errors you may encounter before using in script.
- Output filters: show errors, hide all excluded and show only allowed functions using a list of function names
- Console customization options: set custom text size, color, page length, line spacing
Notes:
- uses Pinescript v3 Compatibility Framework
- uses Common String Functions Library
- has to be a separate script to reduce the number of local scopes in Common Array Function Library, there's no way to merge these scripts into a single library.
- lets you live test all standard array functions for errors. If you see an error - change params in UI
- array types that are not supported by certain functions and producing a compilation error were disabled with "error" showing up as result
- if you see "Loop too long" error - hide/unhide or reattach the script
- doesn't use pagination, a single str contains all output
- for most array functions to work (except push), an array must be defined with at least 1 pre-existing dummy element 0.
- array.slice and array.fill require from_index < to_index otherwise error
- array.join only supports string arrays, and delimiter must be a const string, can't be var/input. Use join_any_array to join any array type into string. You can also use tostring() to join int, float arrays.
- array.sort only supports int, float arrays. Use sort_any_array from the Common Array Function Library to sort any array type.
- array.sort only sorts values, doesn't preserve indexes. Use sort_any_array from the Common Array Function Library to sort any array while preserving indexes.
- array.concat appends string arrays in reverse order, other array types are appended correctly
- array.covariance requires 2 int, float arrays of the same size
- tostring(flag) works only for internal bool vars, flag expression can't depend on any inputs of any type, use bool_to_str instead
- you can't create an if/function that returns var type value/array - compiler uses strict types and doesn't allow that
- however you can assign array of any type to another array of any type creating an arr pointer of invalid type that must be reassigned to a matching array type before used in any expression to prevent error
- source_array and create_any_array2 use this loophole to return an int_arr pointer of a var type array
- this works for all array types defined with/without var keyword. This doesn't work for string arrays defined with var keyword for some reason
- you can't do this with var type vars, this can be done only with var type arrays because they are pointers passed by reference, while vars are the actual values passed by value.
- wrapper functions solve the problem of returning var array types. This is the only way of doing it when the top level arr type is undefined.
- you can only pass a var type value/array param to a function if all functions inside support every type - otherwise error
- alternatively values of every type must be passed simultaneously and processed separately by corresponding if branches/functions supporting these particular types returning a common single result type
- get_var_types solves this problem by generating a list of dummy values of every possible type including the source type, allowing a single valid branch to execute without error
- examples of functions supporting all array types: array.size, array.get, array.push. Examples of functions with limited type support: array.sort, array.join, array.max, tostring
- unlike var params/global vars, you can modify array params and global arrays directly from inside functions using standard array functions, but you can't use := (it only works for local arrays)
- inside function always work with array.copy to prevent accidental array modification
- you can't compare arrays
- there's no na equivalent for arrays, na(arr) doesn't work
P.S. A wide array of skills calls for an even wider array of responsibilities
List of functions:
- array.avg(arr)
- array.clear(arr)
- array.concat(arr1, arr2)
- array.copy(arr)
- array.covariance(arr1, arr2)
- array.fill(arr, value, index_from, index_to)
- array.get(arr, index)
- array.includes(arr, value)
- array.indexof(arr, value)
- array.insert(arr, index, value)
- array.join(arr, delimiter)
- array.lastindexof(arr, value)
- array.max(arr)
- array.median(arr)
- array.min(arr)
- array.mode(arr)
- array.pop(arr)
- array.push(arr, value)
- array.range(arr)
- array.remove(arr, index)
- array.reverse(arr)
- array.set(arr, index, value)
- array.shift(arr)
- array.size(arr)
- array.slice(arr, index_from, index_to)
- array.sort(arr, order)
- array.standardize()
- array.stdev(arr)
- array.sum(arr)
- array.unshift(arr, value)
- array.variance(arr)

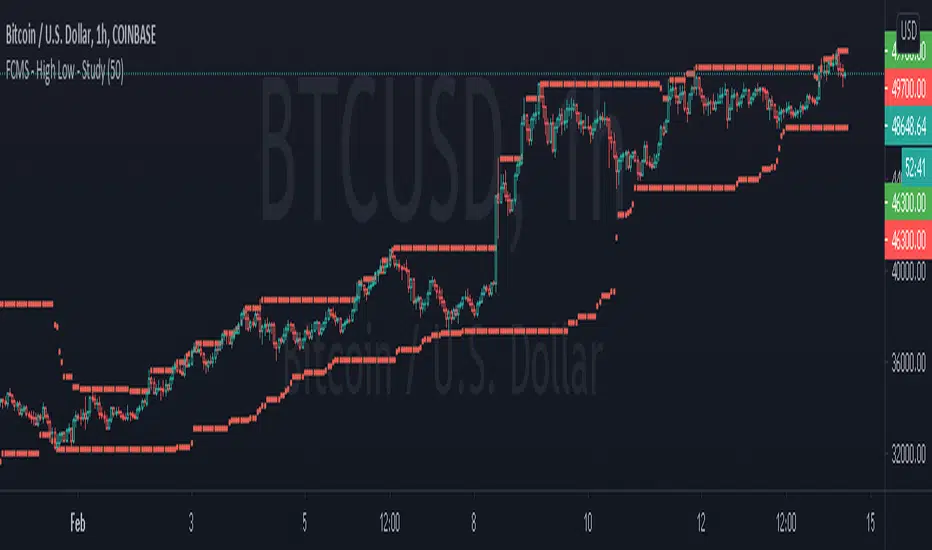
FCMS - Arrays Exercise - High Low with Arrays - StudyThis is just a script to exercise the use of arrays on pine script.
I think we could say that every for loop we had in pine script before the arrays, is eligible to become an array.
Our script will get more efficient and more reliable.
As every "if" case is elegible to became a function
I confess I was addicted to use if, else if, else in my codes, but recently i've been updating my scripts and it's became more efficient
I couldn't find an array function that insert an value removing the oldest one, so I'm using this condition to "shift" the first value.
I'll update as soon as I find a better way to do it.
In any case, for this specific goal, we already have an built in function, as I let on script
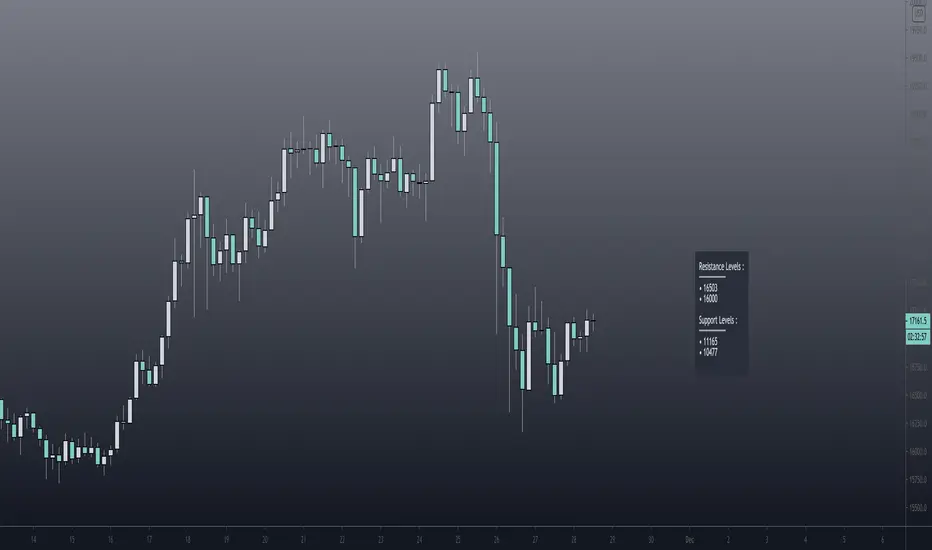
Pivot Support / Resistance Panel [JV]Hello Traders,
First all of thanks to LonesomeTheBlue for making me grasp arrays, a wonderful addition to Pine Script.
This indicator uses arrays to find Pivot Points and mark them as Support / Resistance.
It displays an info panel with the latest values.
This code was written using the following standards:
• PineCoders Coding Conventions for Pine: www.pinecoders.com
Configurable options:
Up to 6 Support / Resistance Levels.
Pivot Lookback Period.
Panel Color.
Text Color.
Panel Offset.
Panel Size.
Enjoy!
Array SMACalcuating SMA on an Array
In this script i show you how to calculate SMA on an array.
Several values are plotted just for illustration.
Steps to follow:
- make sure you have an array with values (source array)
- create a blank array (pref. with the same size)
- call the function array_sma
This function fills the empty array with the SMA values of the source array.

Logistic RSI, STOCH, ROC, AO, ... by DGTExperimental attemt of applying Logistic Map Equation for some of widly used indicators.
With this study "Awesome Oscillator (AO)", "Rate of Change (ROC)", "Relative Strength Index (RSI)", "Stochastic (STOCH)" and a custom interpretation of Logistic Map Equation is presented
Calculations with Logistic Map Equation makes sense when the calculated results are iterated many times within the same equation.
Here is the Logistic Map Equation : Xn+1 = r * Xn * (1 - Xn)
Where, the value of r is the key for this equation which changes amazingly the behaviour of the Logistic Map.
The value we have asigned for r is less then 1 and greater than 0 ( 0 < r < 1) and in this case the iterations performed with the maximum number of output series allowed by Pine is quite enough for our purpose and thanks to arrays we can easiliy store them for further processing
What we have as output:
Each iteration result is then plotted (excluding plotting the first iteration), as circles or line based on user preference
Values above and below zero level (0) are coloured differently to emphasis bull and bear power
Finally Standard Deviation of Array's Elements is ploted as line. Users may choose to display this line only
So where it comes the indicators "Awesome Oscillator (AO)", "Rate of Change (ROC)", "Relative Strength Index (RSI)", "Stochastic (STOCH)".
Those are the indicators whose values are assigned to our key varaiable in the Logistic Map equation forulma which is r
Further details regarding Logistic Map can found under the description of “Logistic EMA w/ Signals by DGT” study
Disclaimer:
Trading success is all about following your trading strategy and the indicators should fit within your trading strategy, and not to be traded upon solely
The script is for informational and educational purposes only. Use of the script does not constitute professional and/or financial advice. You alone have the sole responsibility of evaluating the script output and risks associated with the use of the script. In exchange for using the script, you agree not to hold dgtrd TradingView user liable for any possible claim for damages arising from any decision you make based on use of the script

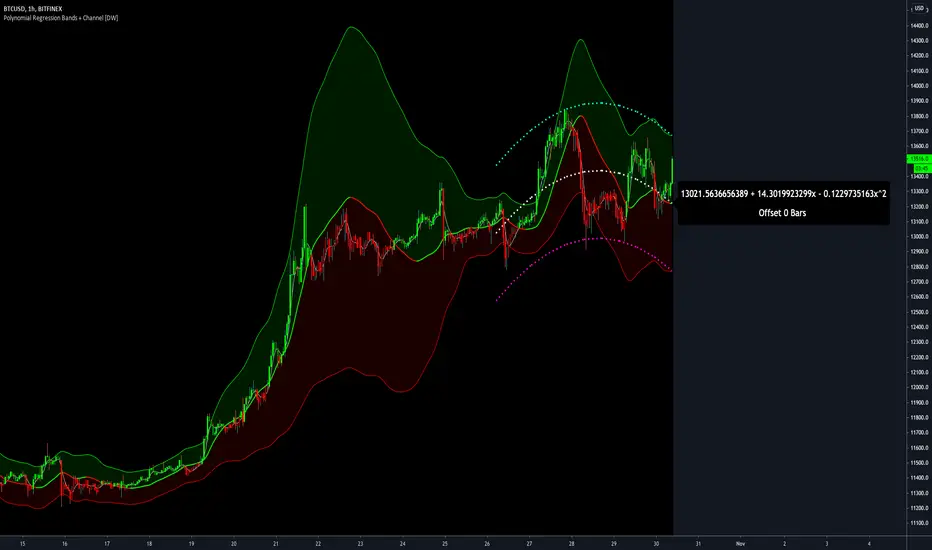
Polynomial Regression Bands + Channel [DW]This is an experimental study designed to calculate polynomial regression for any order polynomial that TV is able to support.
This study aims to educate users on polynomial curve fitting, and the derivation process of Least Squares Moving Averages (LSMAs).
I also designed this study with the intent of showcasing some of the capabilities and potential applications of TV's fantastic new array functions.
Polynomial regression is a form of regression analysis in which the relationship between the independent variable x and the dependent variable y is modeled as a polynomial of nth degree (order).
For clarification, linear regression can also be described as a first order polynomial regression. The process of deriving linear, quadratic, cubic, and higher order polynomial relationships is all the same.
In addition, although deriving a polynomial regression equation results in a nonlinear output, the process of solving for polynomials by least squares is actually a special case of multiple linear regression.
So, just like in multiple linear regression, polynomial regression can be solved in essentially the same way through a system of linear equations.
In this study, you are first given the option to smooth the input data using the 2 pole Super Smoother Filter from John Ehlers.
I chose this specific filter because I find it provides superior smoothing with low lag and fairly clean cutoff. You can, of course, implement your own filter functions to see how they compare if you feel like experimenting.
Filtering noise prior to regression calculation can be useful for providing a more stable estimation since least squares regression can be rather sensitive to noise.
This is especially true on lower sampling lengths and higher degree polynomials since the regression output becomes more "overfit" to the sample data.
Next, data arrays are populated for the x-axis and y-axis values. These are the main datasets utilized in the rest of the calculations.
To keep the calculations more numerically stable for higher periods and orders, the x array is filled with integers 1 through the sampling period rather than using current bar numbers.
This process can be thought of as shifting the origin of the x-axis as new data emerges.
This keeps the axis values significantly lower than the 10k+ bar values, thus maintaining more numerical stability at higher orders and sample lengths.
The data arrays are then used to create a pseudo 2D matrix of x power sums, and a vector of x power*y sums.
These matrices are a representation the system of equations that need to be solved in order to find the regression coefficients.
Below, you'll see some examples of the pattern of equations used to solve for our coefficients represented in augmented matrix form.
For example, the augmented matrix for the system equations required to solve a second order (quadratic) polynomial regression by least squares is formed like this:
(∑x^0 ∑x^1 ∑x^2 | ∑(x^0)y)
(∑x^1 ∑x^2 ∑x^3 | ∑(x^1)y)
(∑x^2 ∑x^3 ∑x^4 | ∑(x^2)y)
The augmented matrix for the third order (cubic) system is formed like this:
(∑x^0 ∑x^1 ∑x^2 ∑x^3 | ∑(x^0)y)
(∑x^1 ∑x^2 ∑x^3 ∑x^4 | ∑(x^1)y)
(∑x^2 ∑x^3 ∑x^4 ∑x^5 | ∑(x^2)y)
(∑x^3 ∑x^4 ∑x^5 ∑x^6 | ∑(x^3)y)
This pattern continues for any n ordered polynomial regression, in which the coefficient matrix is a n + 1 wide square matrix with the last term being ∑x^2n, and the last term of the result vector being ∑(x^n)y.
Thanks to this pattern, it's rather convenient to solve the for our regression coefficients of any nth degree polynomial by a number of different methods.
In this script, I utilize a process known as LU Decomposition to solve for the regression coefficients.
Lower-upper (LU) Decomposition is a neat form of matrix manipulation that expresses a 2D matrix as the product of lower and upper triangular matrices.
This decomposition method is incredibly handy for solving systems of equations, calculating determinants, and inverting matrices.
For a linear system Ax=b, where A is our coefficient matrix, x is our vector of unknowns, and b is our vector of results, LU Decomposition turns our system into LUx=b.
We can then factor this into two separate matrix equations and solve the system using these two simple steps:
1. Solve Ly=b for y, where y is a new vector of unknowns that satisfies the equation, using forward substitution.
2. Solve Ux=y for x using backward substitution. This gives us the values of our original unknowns - in this case, the coefficients for our regression equation.
After solving for the regression coefficients, the values are then plugged into our regression equation:
Y = a0 + a1*x + a1*x^2 + ... + an*x^n, where a() is the ()th coefficient in ascending order and n is the polynomial degree.
From here, an array of curve values for the period based on the current equation is populated, and standard deviation is added to and subtracted from the equation to calculate the channel high and low levels.
The calculated curve values can also be shifted to the left or right using the "Regression Offset" input
Changing the offset parameter will move the curve left for negative values, and right for positive values.
This offset parameter shifts the curve points within our window while using the same equation, allowing you to use offset datapoints on the regression curve to calculate the LSMA and bands.
The curve and channel's appearance is optionally approximated using Pine's v4 line tools to draw segments.
Since there is a limitation on how many lines can be displayed per script, each curve consists of 10 segments with lengths determined by a user defined step size. In total, there are 30 lines displayed at once when active.
By default, the step size is 10, meaning each segment is 10 bars long. This is because the default sampling period is 100, so this step size will show the approximate curve for the entire period.
When adjusting your sampling period, be sure to adjust your step size accordingly when curve drawing is active if you want to see the full approximate curve for the period.
Note that when you have a larger step size, you will see more seemingly "sharp" turning points on the polynomial curve, especially on higher degree polynomials.
The polynomial functions that are calculated are continuous and differentiable across all points. The perceived sharpness is simply due to our limitation on available lines to draw them.
The approximate channel drawings also come equipped with style inputs, so you can control the type, color, and width of the regression, channel high, and channel low curves.
I also included an input to determine if the curves are updated continuously, or only upon the closing of a bar for reduced runtime demands. More about why this is important in the notes below.
For additional reference, I also included the option to display the current regression equation.
This allows you to easily track the polynomial function you're using, and to confirm that the polynomial is properly supported within Pine.
There are some cases that aren't supported properly due to Pine's limitations. More about this in the notes on the bottom.
In addition, I included a line of text beneath the equation to indicate how many bars left or right the calculated curve data is currently shifted.
The display label comes equipped with style editing inputs, so you can control the size, background color, and text color of the equation display.
The Polynomial LSMA, high band, and low band in this script are generated by tracking the current endpoints of the regression, channel high, and channel low curves respectively.
The output of these bands is similar in nature to Bollinger Bands, but with an obviously different derivation process.
By displaying the LSMA and bands in tandem with the polynomial channel, it's easy to visualize how LSMAs are derived, and how the process that goes into them is drastically different from a typical moving average.
The main difference between LSMA and other MAs is that LSMA is showing the value of the regression curve on the current bar, which is the result of a modelled relationship between x and the expected value of y.
With other MA / filter types, they are typically just averaging or frequency filtering the samples. This is an important distinction in interpretation. However, both can be applied similarly when trading.
An important distinction with the LSMA in this script is that since we can model higher degree polynomial relationships, the LSMA here is not limited to only linear as it is in TV's built in LSMA.
Bar colors are also included in this script. The color scheme is based on disparity between source and the LSMA.
This script is a great study for educating yourself on the process that goes into polynomial regression, as well as one of the many processes computers utilize to solve systems of equations.
Also, the Polynomial LSMA and bands are great components to try implementing into your own analysis setup.
I hope you all enjoy it!
--------------------------------------------------------
NOTES:
- Even though the algorithm used in this script can be implemented to find any order polynomial relationship, TV has a limit on the significant figures for its floating point outputs.
This means that as you increase your sampling period and / or polynomial order, some higher order coefficients will be output as 0 due to floating point round-off.
There is currently no viable workaround for this issue since there isn't a way to calculate more significant figures than the limit.
However, in my humble opinion, fitting a polynomial higher than cubic to most time series data is "overkill" due to bias-variance tradeoff.
Although, this tradeoff is also dependent on the sampling period. Keep that in mind. A good rule of thumb is to aim for a nice "middle ground" between bias and variance.
If TV ever chooses to expand its significant figure limits, then it will be possible to accurately calculate even higher order polynomials and periods if you feel the desire to do so.
To test if your polynomial is properly supported within Pine's constraints, check the equation label.
If you see a coefficient value of 0 in front of any of the x values, reduce your period and / or polynomial order.
- Although this algorithm has less computational complexity than most other linear system solving methods, this script itself can still be rather demanding on runtime resources - especially when drawing the curves.
In the event you find your current configuration is throwing back an error saying that the calculation takes too long, there are a few things you can try:
-> Refresh your chart or hide and unhide the indicator.
The runtime environment on TV is very dynamic and the allocation of available memory varies with collective server usage.
By refreshing, you can often get it to process since you're basically just waiting for your allotment to increase. This method works well in a lot of cases.
-> Change the curve update frequency to "Close Only".
If you've tried refreshing multiple times and still have the error, your configuration may simply be too demanding of resources.
v4 drawing objects, most notably lines, can be highly taxing on the servers. That's why Pine has a limit on how many can be displayed in the first place.
By limiting the curve updates to only bar closes, this will significantly reduce the runtime needs of the lines since they will only be calculated once per bar.
Note that doing this will only limit the visual output of the curve segments. It has no impact on regression calculation, equation display, or LSMA and band displays.
-> Uncheck the display boxes for the drawing objects.
If you still have troubles after trying the above options, then simply stop displaying the curve - unless it's important to you.
As I mentioned, v4 drawing objects can be rather resource intensive. So a simple fix that often works when other things fail is to just stop them from being displayed.
-> Reduce sampling period, polynomial order, or curve drawing step size.
If you're having runtime errors and don't want to sacrifice the curve drawings, then you'll need to reduce the calculation complexity.
If you're using a large sampling period, or high order polynomial, the operational complexity becomes significantly higher than lower periods and orders.
When you have larger step sizes, more historical referencing is used for x-axis locations, which does have an impact as well.
By reducing these parameters, the runtime issue will often be solved.
Another important detail to note with this is that you may have configurations that work just fine in real time, but struggle to load properly in replay mode.
This is because the replay framework also requires its own allotment of runtime, so that must be taken into consideration as well.
- Please note that the line and label objects are reprinted as new data emerges. That's simply the nature of drawing objects vs standard plots.
I do not recommend or endorse basing your trading decisions based on the drawn curve. That component is merely to serve as a visual reference of the current polynomial relationship.
No repainting occurs with the Polynomial LSMA and bands though. Once the bar is closed, that bar's calculated values are set.
So when using the LSMA and bands for trading purposes, you can rest easy knowing that history won't change on you when you come back to view them.
- For those who intend on utilizing or modifying the functions and calculations in this script for their own scripts, I included debug dialogues in the script for all of the arrays to make the process easier.
To use the debugs, see the "Debugs" section at the bottom. All dialogues are commented out by default.
The debugs are displayed using label objects. By default, I have them all located to the right of current price.
If you wish to display multiple debugs at once, it will be up to you to decide on display locations at your leisure.
When using the debugs, I recommend commenting out the other drawing objects (or even all plots) in the script to prevent runtime issues and overlapping displays.
CC - Array-meta Consolidated Interval Display (ACID)This script extends my other two Array examples (which I've also provided to you open source):
The Ticker-centric 5m,15m,45m,1h,4h,1d resolution labels using arrays:
And the more Macro VIX,GLD,TLT,QQQ,SPY,IWM 1d resolution labels using arrays:
This script aims to show how to use min/max/avg with Arrays easily. My next example after this will be exploring the usage of variance versus covariance ratios over different periodic interval resolutions. Currently, this is using the following intervals: 5m,15m,45m,1h,4h,1d. It takes these intervals, calculates the values at those resolutions and puts the absolute min and max from the 5 minute to the 1 day resolutions.
It's more of an example of the power that arrays can hold, as all this truly is right now is a min/max bound calculator. The real gem lies in the avg calculators for multiple resoltuions tied into a single label with readable data. Check out the code and let me know what you think. If you need more examples, the other two scripts I mentioned before are also open source.
Using this on intervals of less than 1D sometimes times out, the way I wrote it is memory intensive, may not work for non-pro users.
Thanks!
NONE OF THIS IS FOREWARD LOOKING STATEMENTS, THIS IS NOT A PREDECTIVE ANALYSIS TOOL. THIS IS A RESEARCH ATTEMPT AT A NOVEL INDICATOR. I am not responsible for outcomes using it.
Please use and give criticisms freely. I am experimenting with combining resolutions and comparing covariance values at different levels right now, so let me know your thoughts! The last indicator will likely not be open source, but may be depending on how complex I get.

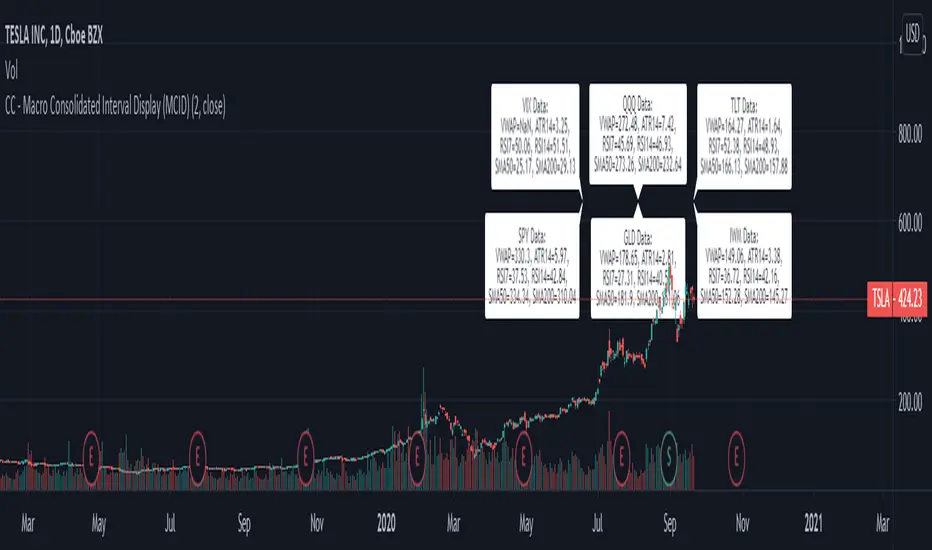
CC - Macro Consolidated Interval Display (MCID)Ever wish you didn't have to rapidly flip between 6 different tickers to get the full picture?
Yeah, me too. Do you also wish that you kind of understood how the shift / unshift function works for arrays?
Yeah, I did too. Both of those birds are taken care of with one stone!
The Macro Consolidated Interval Display uses the new Array structure and security to display data for VIX, GLD, TLT, QQQ, SPY and IWM (at a 1D interval) SIMUTANEOUSLY! Regardless of which ticker you're looking at you can get the full picture of macro futures data without flipping around to get it.
This is my first script trying to use arrays. It basically shows the following a 1d interval:
ATR14, RSI7, RSI14, SMA50, SMA200 and VWAP for VIX.
ATR14, RSI7, RSI14, SMA50, SMA200 and VWAP for GLD.
ATR14, RSI7, RSI14, SMA50, SMA200 and VWAP for TLT.
ATR14, RSI7, RSI14, SMA50, SMA200 and VWAP for QQQ.
ATR14, RSI7, RSI14, SMA50, SMA200 and VWAP for SPY.
ATR14, RSI7, RSI14, SMA50, SMA200 and VWAP for IWM
To make it more or less busy, I've allowed you to toggle off any of the levels you wish. I've also chosen to leave this as open source, as it's nothing too experimental, and I hope that it can gain some traction as an Array example that the public can use! If you don't like the different values that are shown, use this source code example as a spring-board to put values that you do care about onto the labels.
If this code has helped you at all please drop me a like or some constructive criticism if you do not think it's worth a like.
Good luck and happy trading friends. This should be compatible with my CID as well:
If this gets traction, I will post something similar for a dynamic combination of tickers and intervals that you can set yourself.
CC - Consolidated Interval Display (CID)Ever wish you didn't have to rapidly flip between 6 different intervals to get the full picture?
Yeah, me too. Do you also wish that you kind of understood how the shift / unshift function works for arrays?
Yeah, I did too. Both of those birds are taken care of with one stone!
The Consolidated Interval Display uses the new Array structure and security to display data for 5m, 15m, 45m, 1h, 4h and 1d intervals SIMUTANEOUSLY! Regardless of which interval you're looking at you can get the full picture of numerical data without flipping around to get it.
This is my first script trying to use arrays. It basically shows the following for the given ticker:
ATR14, RSI7, RSI14, SMA50, SMA200 and VWAP at the 5 minute level.
ATR14, RSI7, RSI14, SMA50, SMA200 and VWAP at the 15 minute level.
ATR14, RSI7, RSI14, SMA50, SMA200 and VWAP at the 45 minute level.
ATR14, RSI7, RSI14, SMA50, SMA200 and VWAP at the 1 hour level.
ATR14, RSI7, RSI14, SMA50, SMA200 and VWAP at the 4 hour level.
ATR14, RSI7, RSI14, SMA50, SMA200 and VWAP at the 1 day level.
To make it more or less busy, I've allowed you to toggle off any of the levels you wish. I've also chosen to leave this as open source, as it's nothing too experimental, and I hope that it can gain some traction as an Array example that the public can use! If you don't like the different values that are shown, use this source code example as a spring-board to put values that you do care about onto the labels.
If this code has helped you at all please drop me a like or some constructive criticism if you do not think it's worth a like.
Good luck and happy trading friends.
If this gets traction, I will post something similar for a combination of SPY, VIX, GOLD, QQQ, IWM and TLT.

Z-Score The z-score is a way of counting the number of standard deviations between a given data value and the mean of the data set.
Z-score = (x̄ - μ) / (σ / √ n)
x̄ = sample mean (using the array.avg function = array(a,close ), where i = 1 to 21)
μ = population mean ( = avg(close, n))
σ = standard deviation of the population ( = stdev(close,n))
n = number of 'close' or trading day closes
n = input
... Note: The previous indicator is part of a larger series of indicators

Resampling Filter Pack [DW]This is an experimental study that calculates filter values at user defined sample rates.
This study is aimed to provide users with alternative functions for filtering price at custom sample rates.
First, source data is resampled using the desired rate and cycle offset. The highest possible rate is 1 bar per sample (BPS).
There are three resampling methods to choose from:
-> BPS - Resamples based on the number of bars.
-> Interval - Resamples based on time in multiples of current charting timeframe.
-> PA - Resamples based on changes in price action by a specified size. The PA algorithm in this script is derived from my Range Filter algorithm.
The range for PA method can be sized in points, pips, ticks, % of price, ATR, average change, and absolute quantity.
Then, the data is passed through one of my custom built filter functions designed to calculate filter values upon trigger conditions rather than bars.
In this study, these functions are used to calculate resampled prices based on bar rates, but they can be used and modified for a number of purposes.
The available conditional sampling filters in this study are:
-> Simple Moving Average (SMA)
-> Exponential Moving Average (EMA)
-> Zero Lag Exponential Moving Average (ZLEMA)
-> Double Exponential Moving Average (DEMA)
-> Rolling Moving Average (RMA)
-> Weighted Moving Average (WMA)
-> Hull Moving Average (HMA)
-> Exponentially Weighted Hull Moving Average (EWHMA)
-> Two Pole Butterworth Low Pass Filter (BLP)
-> Two Pole Gaussian Low Pass Filter (GLP)
-> Super Smoother Filter (SSF)
Downsampling is a powerful filtering approach that can be applied in numerous ways. However, it does suffer from a trade off, like most studies do.
Reducing the sample rate will completely eliminate certain levels of noise, at the cost of some spectral distortion. The lower your sample rate is, the more distortion you'll see.
With that being said, for analyzing trends, downsampling may prove to be one of your best friends!

Pinescript Bubble Sort using ArraysThe new feature of arrays allows for a multitude of new possibilities within Pinescript. This script implements a bubble sort function with most probable efficiency of О(n^2) with a best-case being O(n). This sort does not require large amounts of memory to process and has advantages when sorting small lists of data.
The main advantages: Bubble sort is an in-place sorting algorithm. It does not require extra memory or even stack space like in the case of merge sort or quicksort.
The main disadvantages: In the worst case the time complexity is equal to O(n^2) which is not efficient in comparison to other sorts which can have a time complexity of O(n*logn).
The Pseudocode for a bubble sort is as follows:
begin BubbleSort(list)
for all elements of list
if list > list
swap(list , list )
end if
end for
return list
end BubbleSort
The results of the sort are plotted against the unsorted list and overlayed on the chart.
A big thanks to Alex Grover for the help.
Range Filter [DW]This is an experimental study designed to filter out minor price action for a clearer view of trends.
Inspired by the QQE's volatility filter, this filter applies the process directly to price rather than to a smoothed RSI.
First, a smooth average price range is calculated for the basis of the filter and multiplied by a specified amount.
Next, the filter is calculated by gating price movements that do not exceed the specified range.
Lastly the target ranges are plotted to display the prices that will trigger filter movement.
Custom bar colors are included. The color scheme is based on the filtered price trend.
