D15 Precision IndicatorD15 Precision Indicator
The D15 Precision Indicator is a high-accuracy intraday trading tool optimized for 15-minute charts. It identifies precise BUY and SELL signals only when all key conditions align:
✅ Price above/below EMA 21 & EMA 50
✅ Price above/below VWAP
✅ Price within predefined support/resistance zones
✅ Break of Structure (BOS) confirmed by pivot levels
✅ High-volume breakout candle
✅ Optional confirmation from previous candles for added precision
The script includes:
Clear visual arrows (BUY/SELL)
Dynamic background highlights for signals
Support/Resistance zone boxes
All key indicators plotted (EMA, VWAP, zones)
Ideal for disciplined traders aiming for 80%+ win rate through strict signal filtering and visual clarity.
Bands and Channels

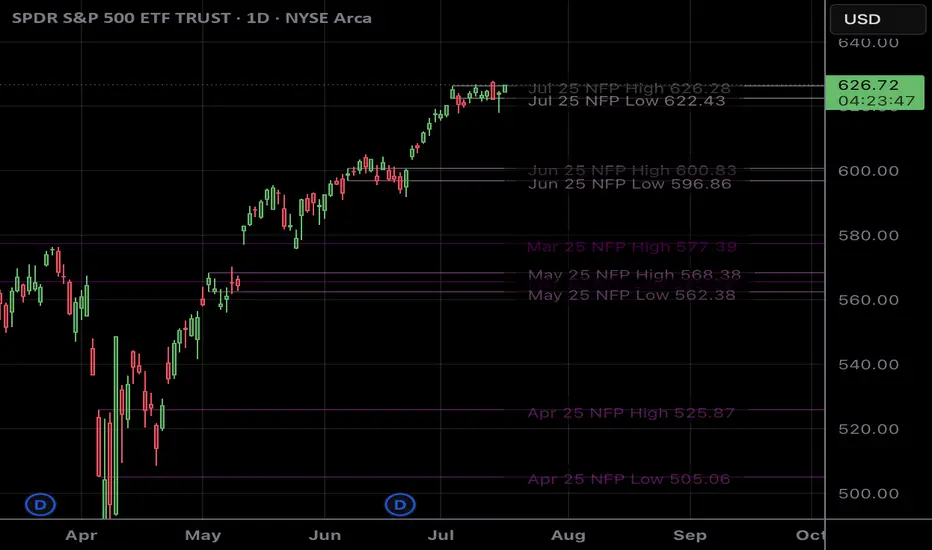
NFP RangesPlots the NFP daily ranges for NFP days. Includes extended hours ranges when the time frame is sub 1D, otherwise, only the daily range is taken.
NFP Dates are pre-populated through 2029 and historically through 2022. Will update script to include farther-out dates before they become necessary.
AI Breakout Bands (Zeiierman)█ Overview
AI Breakout Bands (Zeiierman) is an adaptive trend and breakout detection system that combines Kalman filtering with advanced K-Nearest Neighbor (KNN) smoothing. The result is a smart, self-adjusting band structure that adapts to dynamic market behavior, identifying breakout conditions with precision and visual clarity.
At its core, this indicator estimates price behavior using a two-dimensional Kalman filter (position + velocity), then enhances the smoothing process with a nonlinear, similarity-based KNN filter. This unique blend enables it to handle noisy markets and directional shifts with both speed and stability — providing breakout traders and trend followers a reliable framework to act on.
Whether you're identifying volatility expansions, capturing trend continuations, or spotting early breakout conditions, AI Breakout Bands gives you a mathematically grounded, visually adaptive roadmap of real-time market structure.
█ How It Works
⚪ Kalman Filter Engine
The Kalman filter models price movement as a state system with two components:
Position (price)
Velocity (trend direction)
It recursively updates predictions using real-time price as a noisy observation, balancing responsiveness with smoothness.
Process Noise (Position) controls sensitivity to sudden moves.
Process Noise (Velocity) controls smoothing of directional flow.
Measurement Noise (R) defines how much the filter "trusts" live price data.
This component alone creates a responsive yet stable estimate of the market’s center of gravity.
⚪ Advanced K-Neighbor Smoothing
After the Kalman estimate is computed, the script applies a custom K-Nearest Neighbor (KNN) smoother.
Rather than averaging raw values, this method:
Finds K most similar past Kalman values
Weighs them by similarity (inverse of absolute distance)
Produces a smoother that emphasizes structural similarity
This nonlinear approach gives the indicator an AI feature — reacting fast when needed, yet staying calm in consolidation.
█ How to Use
⚪ Trend Recognition
The line color shifts dynamically based on slope direction and breakout confirmation.
Bullish conditions: price above the mid band with positive slope
Bearish conditions: price below the mid band with negative slope
⚪ Breakout Signals
Price breaking above or below the bands may signal momentum acceleration.
Combine with your own volume or momentum confirmation for stronger entries.
Bands adapt to market noise, helping filter out low-quality whipsaws.
█ Settings
Process Noise (Position): Controls Kalman filter’s sensitivity to price changes.
Process Noise (Velocity): Controls smoothing of directional component.
Measurement Noise (R): Defines how much trust is placed in price data.
K-Neighbor Length: Number of historical Kalman values considered for smoothing.
Slope Calculation Window: Number of bars used to compute trend slope of the smoothed Kalman.
Band Lookback (MAE): Rolling period for average absolute error.
Band Multiplier: Multiplies MAE to determine band width.
-----------------
Disclaimer
The content provided in my scripts, indicators, ideas, algorithms, and systems is for educational and informational purposes only. It does not constitute financial advice, investment recommendations, or a solicitation to buy or sell any financial instruments. I will not accept liability for any loss or damage, including without limitation any loss of profit, which may arise directly or indirectly from the use of or reliance on such information.
All investments involve risk, and the past performance of a security, industry, sector, market, financial product, trading strategy, backtest, or individual's trading does not guarantee future results or returns. Investors are fully responsible for any investment decisions they make. Such decisions should be based solely on an evaluation of their financial circumstances, investment objectives, risk tolerance, and liquidity needs.


Ultimate JLines & MTF EMA (Configurable, Labels)## Ultimate JLines & MTF EMA (Configurable, Labels) — Script Overview
This Pine Script is a comprehensive, multi-timeframe indicator based on J Trader concepts. It overlays various Exponential Moving Averages (EMAs), VWAP, inside bar highlights, and dynamic labels onto price charts. The script is highly configurable, allowing users to tailor which elements are displayed and how they appear.
### Key Features
#### 1. **Multi-Timeframe JLines**
- **JLines** are pairs of EMAs (default lengths: 72 and 89) calculated on several timeframes:
- 1 minute (1m)
- 3 minutes (3m)
- 5 minutes (5m)
- 1 hour (1h)
- Custom timeframe (user-selectable)
- Each pair can be visualized as individual lines and as a "cloud" (shaded area between the two EMAs).
- Colors and opacity for each timeframe are user-configurable.
#### 2. **200 EMA on Multiple Timeframes**
- Plots the 200-period EMA on selectable timeframes: 1m, 3m, 5m, 15m, and 1h.
- Each can be toggled independently and colored as desired.
#### 3. **9 EMA and VWAP**
- Plots a 9-period EMA, either on the chart’s current timeframe or a user-specified one.
- Plots VWAP (Volume-Weighted Average Price) for additional trend context.
#### 4. **5/15 EMA Cross Cloud (5min)**
- Calculates and optionally displays a shaded "cloud" between the 5-period and 15-period EMAs on the 5-minute chart.
- Highlights bullish (5 EMA above 15 EMA) and bearish (5 EMA below 15 EMA) conditions with different colors.
- Optionally displays the 5 and 15 EMA lines themselves.
#### 5. **Inside Bar Highlighting**
- Highlights bars where the current high is less than or equal to the previous high and the low is greater than or equal to the previous low (inside bars).
- Color is user-configurable.
#### 6. **9 EMA / VWAP Cross Arrows**
- Plots up/down arrows when the 9 EMA crosses above or below the VWAP.
- Arrow colors and visibility are configurable.
#### 7. **Dynamic Labels**
- On the most recent bar, displays labels for each enabled line (EMAs, VWAP), offset to the right for clarity.
- Labels include the timeframe, type, and current value.
### Customization Options
- **Visibility:** Each plot (line, cloud, arrow, label) can be individually toggled on/off.
- **Colors:** All lines, clouds, and arrows can be colored to user preference, including opacity for clouds.
- **Timeframes:** JLines and EMAs can be calculated on different timeframes, including a custom one.
- **Label Text:** Labels dynamically reflect current indicator values and are color-coded to match their lines.
### Technical Implementation Highlights
- **Helper Functions:** Functions abstract away the logic for multi-timeframe EMA calculation.
- **Security Calls:** Uses `request.security` to fetch data from other timeframes, ensuring accurate multi-timeframe plotting.
- **Efficient Label Management:** Deletes old labels and creates new ones only on the last bar to avoid clutter and maintain performance.
- **Conditional Plotting:** All visual elements are conditionally plotted based on user input, making the indicator highly flexible.
### Use Cases
- **Trend Identification:** Multiple EMAs and VWAP help traders quickly identify trend direction and strength across timeframes.
- **Support/Resistance:** 200 EMA and JLines often act as dynamic support/resistance levels.
- **Entry/Exit Signals:** Crosses between 9 EMA and VWAP, as well as 5/15 EMA clouds, can signal potential trade entries or exits.
- **Pattern Recognition:** Inside bar highlights aid in spotting consolidation and breakout patterns.
### Summary Table of Configurable Elements
| Feature | Timeframes | Cloud Option | Label Option | Color Customizable | Description |
|----------------------------|-------------------|--------------|--------------|--------------------|-----------------------------------------------|
| JLines (72/89 EMA) | 1m, 3m, 5m, 1h, Custom | Yes | Yes | Yes | Key trend-following EMAs with cloud fill |
| 200 EMA | 1m, 3m, 5m, 15m, 1h | No | Yes | Yes | Long-term trend indicator |
| 9 EMA | Any | No | Yes | Yes | Short-term trend indicator |
| VWAP | Chart TF | No | Yes | Yes | Volume-weighted average price |
| 5/15 EMA Cloud (5m) | 5m | Yes | No | Yes | Bullish/bearish cloud between 5/15 EMAs |
| Inside Bar Highlight | Chart TF | No | N/A | Yes | Highlights price consolidation |
| 9 EMA / VWAP Cross Arrows | Chart TF | No | N/A | Yes | Marks EMA/VWAP crossovers with arrows |
This script is ideal for traders seeking a robust, multi-timeframe overlay that combines trend, momentum, and pattern signals in a single, highly customizable indicator. I do not advocate to subscribe to JTrades or the system they tout. This is based on my own observations and not a copy of any JTrades scripts. It is open source to allow full transparency.

N-Pattern Detector (Advanced Logic)Introduction
The N-Pattern Detector (Advanced Logic) is a powerful Pine Script-based tool designed to identify a specific price structure known as the "N-pattern", which often indicates trend continuation or potential breakout points in the market. This pattern combines zigzag pivot logic, retracement filters, volume confirmation, and trend alignment, offering high-probability trading signals.
It is ideal for traders who want to automate pattern detection while applying smart filters to reduce false signals in various markets — including stocks, forex, crypto, and indices.
What is the N-Pattern?
The N-pattern is a 3-leg price formation consisting of points A-B-C-D. It typically follows this structure:
Bullish N-Pattern:
A → Low Pivot
B → Higher High (Impulse)
C → Higher Low (Retracement)
D → Breakout above B (Confirmation)
Bearish N-Pattern:
A → High Pivot
B → Lower Low (Impulse)
C → Lower High (Retracement)
D → Breakdown below B (Confirmation)
The pattern essentially reflects a trend–pullback–breakout structure, making it suitable for continuation trades.
Key Features
1. Intelligent ZigZag Pivot Detection
Uses pivot highs/lows to define key swing points (A, B, C).
Adjustable ZigZag depth to control pattern sensitivity.
Filters noise and avoids false signals in volatile markets.
2. Retracement Validation
Validates the B→C leg as a proper pullback using Fibonacci-based thresholds.
User-defined min and max retracement settings (e.g., 38.2% to 78.6% of A→B leg).
3. Trend Filter via EMA
Filters patterns based on trend direction using a customizable EMA (e.g., 200 EMA).
Only detects bullish patterns above EMA and bearish patterns below EMA (optional).
4. Volume Confirmation
Ensures that impulse legs (A→B, C→D) are supported by stronger volume than the correction leg (B→C).
Adds another layer of confirmation and reliability to detected patterns.
5. Target Projections
Automatically draws 100% A→B projected target from point C.
Optional Fibonacci extensions at 1.272 and 1.618 levels for take-profit planning.
Visually plotted on the chart with colored dashed/dotted lines.
6. Clear Visuals & Labels
Connects all pattern points with colored lines.
Clearly labels points A, B, C, D on the chart.
Uses customizable colors for bullish and bearish patterns.
Includes real-time alerts when a valid pattern is detected.
How to Use It
Add to Chart
Apply the indicator to any chart and time frame. It works across all asset classes.
Adjust Inputs (Optional)
Set ZigZag Depth to control pivot detection sensitivity.
Define Min/Max Retracement levels to match your trading style.
Enable or disable Trend and Volume filters for cleaner signals.
Customize EMA length (default: 200) for trend validation.
Wait for Pattern Confirmation
The indicator constantly scans for valid N-patterns.
A pattern is confirmed only after point D forms (breakout or breakdown).
You’ll see the full pattern drawn with target levels.
Set Alerts
Alerts trigger automatically on confirmation of a bullish or bearish pattern.
You can customize these in TradingView’s alerts panel.

TeeLek-BestPositionThis indicator is used to indicate the best buying and selling points.
This indicator will calculate the best buying points (blue) and selling points (orange). The working principle is that the blue point is the point where the RSI is Over Sold, the orange point is the point where the RSI is Over Bought. After that, we will use the Highest Line 100 and Lowest Line 100 to filter the points another layer. And because when Over Bought/Over Sold occurs, there will be continuous signals that are repeated, causing confusion. Therefore, there is a feature to leave a time frame. Set the default value to 24 hours. If a signal occurs, it will be left out.
The appropriate point for buying is:
The point where Over Sold occurs and Closes lower than the Lowest Line 100.
Leave a time frame for 24 hours before a new signal occurs.
The appropriate point for selling is:
The point where Over Bought occurs and Closes higher than the Highest Line 100.
Leave a time frame for 24 hours before a new signal occurs.
It helps us to gradually buy and collect/sell for profit easily without confusion.
อินดิเคเตอร์นี้ใช้ สำหรับบอกจุดซื้อจุดขายที่ดีที่สุด
อินดิเคเตอร์นี้ จะคำนวณจุดซื้อ (สีฟ้า) และจุดขาย (สีส้ม) ที่ดีที่สุดมาให้ โดยหลักการทำงาน คือ จุดสีฟ้า คือจุดที่ RSI Over Sold จุดสีส้ม คือจุดที่ RSI Over Bought หลังจากนั้นเราจะใช้เส้น Highest Line 100 และ Lowest Line 100 เพื่อกรองจุดอีกชั้นหนึ่ง และเนื่องจากเมื่อเกิด Over Bought/Over Sold แล้ว มันจะเกิดสัญญาณต่อเนื่องซ้ำๆ ทำให้สับสน จึงได้มีฟีเจอร์ในการเว้นระยะเวลา ตั้งค่าไว้เริ่มต้นที่ 24 ชั่วโมง ถ้าเกิดสัญญาณแล้วก็จะเว้นระยะออกไป
จุดที่เหมาะสมกับการซื้อ คือ
จุดที่เกิด Over Sold และ Close ต่ำกว่าเส้น Lowest Line 100
เว้นระยะไป 24 ชั่วโมงจึงจะเกิดสัญญาณใหม่อีกครั้ง
จุดที่เหมาะสมกับการขาย คือ
จุดที่เกิด Over Bought และ Close สูงกว่าเส้น Highest Line 100
เว้นระยะไป 24 ชั่วโมงจึงจะเกิดสัญญาณใหม่อีกครั้ง
ช่วยให้เราสามารถ ทยอยซื้อเก็บสะสม/ทยอยขายทำกำไร ได้ง่ายไม่สับสน


KIORI - VWAP mit StdDev + 0,25 Bändern🎯 VWAP Enhanced - Professional Standard Deviation Bands with Precision Zones
This advanced VWAP indicator provides comprehensive price movement analysis through multi-layered standard deviation bands with additional 0.25 precision zones.
🔥 Key Features:
VWAP core line (blue) - Volume Weighted Average Price
3-tier standard deviation bands (1x, 2x, 3x) with individual color coding
0.25 precision zones around EVERY standard deviation line (above/below)
Complete band filling for better visual orientation
Flexible anchor periods (Session, Week, Month, Quarter, Year, Earnings, Dividends, Splits)
📊 Color Coding:
🔵 VWAP + 0.25 zones (Light Blue)
🟢 1x StdDev + 0.25 zones (Green/Light Green)
🟡 2x StdDev + 0.25 zones (Yellow/Light Yellow)
🔴 3x StdDev + 0.25 zones (Red/Light Red)
⚡ Trading Applications:
Support/Resistance at standard deviation lines
Precise entry/exit points through 0.25 zones
Volatility measurement across multiple levels
Mean-reversion strategies with clear target areas
Breakout detection when exceeding outer bands
🎨 Optimized for:
Day trading and scalping
Swing trading strategies
Volatility-based positioning
Multi-timeframe analysis
This indicator combines proven VWAP methodology with high-precision standard deviation zones, providing traders with a professional tool for precise market analysis and positioning

TrendZoneTrendZone - Fibonacci Trendline Indicator
TrendZone is a custom Pine Script indicator that automatically draws fibonacci-based trendlines between key pivot points on your chart.
Key Features:
3 Pivot Points: Set start point, major pivot (reversal), and end point
Dual Trendlines: First trendline (Point 1 → 2) and second trendline (Point 2 → 3)
Fibonacci Levels: Automatically draws 25%, 50%, and 100% fibonacci levels for each trendline
Auto Trend Detection: Automatically identifies bullish/bearish trends and adjusts colors accordingly
Customizable: Full control over colors, line styles, and widths for each fibonacci level
How it Works:
The indicator uses your selected pivot points to create two connected trendline systems. Point 2 serves as the major pivot where the first trend ends and the reversal begins. Each trendline system includes fibonacci retracement levels that extend to the right, helping identify potential support/resistance zones.
Use Cases:
Identifying trend reversals at key pivot points
Finding potential support/resistance levels using fibonacci projections
Visualizing market structure changes between different time periods
Planning entries/exits based on fibonacci trendline interactions
Perfect for traders who use fibonacci analysis combined with trend structure to identify high-probability trading zones.
Bollinger Bottom + Middle Lines with Inline TextThis script visualizes key Bollinger Band levels based on two different SMAs (20 & 50 periods), with clear labeling and a smart price table.
🔸 Features:
Draws lower and middle Bollinger Band lines for both SMA(20) and SMA(50)
Inline text at the end of each line instead of default labels (cleaner view)
A dynamic table in the top-right corner, sorted from highest to lowest level
Color-coded rows:
▪️ Orange → BB20 Mid & BB20 Lower
▪️ Green → BB50 Mid & BB50 Lower
Auto-updates each bar without cluttering the chart
✅ Ideal for identifying technical accumulation zones
✅ Suitable for investors using scaling-in strategies or mean-reversion logic

Fixed First Candle Levels by TF with UTCFixed First Candle Levels by TF with UTC
This script draws High and Low levels of the first candle of each day based on a custom timeframe selected by the user (15m, 30m, 1h, 2h, 4h) and adjusted for the UTC offset.
Features:
✅ Automatically detects the first candle of the day for the selected timeframe
✅ Plots horizontal lines from the start of the day to the end of the day
✅ Highlights the actual candle’s range using a translucent background box
✅ Works across all chart timeframes
✅ Ideal for identifying potential support/resistance zones based on early market structure
You can customize:
Target timeframe (independent from current chart TF)
UTC offset
Useful for intraday traders, breakout strategies, and pre-market planning.

TeeLek-HedgingLineIf we are DCA some assets and it happens to be in a downtrend, sitting and waiting is the best way, but it is not easy to do. There are other ways that allow us to buy DCA and keep collecting more. While the market is falling, don't be depressed. The more you buy, the more it drops. Should you continue buying? Plus, if it goes back to an uptrend, you will also get extra profit. Let's go check it out.
ถ้าเรา DCA ทรัพย์สินอะไรซักอย่างนึงอยู่ แล้วมันดันเป็นขาลงพอดี จะนั่งรอเฉยๆ เป็นวิธีที่ดีที่สุด แต่ไม่ได้ทำกันได้ง่ายๆ นะ ยังมีวิธีอื่นอีก ที่ให้เราสามารถ ซื้อ DCA เก็บของเพิ่มได้เรื่อยๆ ระหว่างที่ตลาดร่วง ไม่จิตตก ยิ่งซื้อ ยิ่งลง จะซื้อต่อดีไหม? แถมถ้า กลับมาเป็นขาขึ้น ยังมีกำไรแถมให้ด้วยนะ ไปหาดูกัน

RSI with Background Colorhis script implements a trading strategy based on an EMA (Exponential Moving Average) crossover, confirmed by the RSI (Relative Strength Index), and includes a built-in stop-loss and take-profit.

VWAP with Prev. Session BandsVWAP with Prev. Session Bands is an advanced indicator based on TradingView’s original VWAP. It adds configurable standard deviation or percentage-based bands, both for the current and previous session. You can anchor the VWAP to various timeframes or events (like Sessions, Weeks, Months, Earnings, etc.) and selectively show up to three bands.
The unique feature of this script is the ability to display the VWAP and bands from the previous session, helping traders visualize mean reversion levels or historical volatility ranges.
Built on top of the official TradingView VWAP implementation, this version provides enhanced flexibility and visual clarity for intraday and swing traders alike.

RAA Buy Sell[RanaAlgo]Overview
The RAA (RanaAlgo Adaptive Average) Buy Sell indicator is a trend-following tool that helps identify potential buy and sell signals based on price deviation from an adaptive moving average. It uses a combination of:
(Fractal Adaptive Moving Average) – Adjusts its sensitivity based on market volatility.
RAA Bands – Dynamic upper/lower bands calculated using a multiplier applied to the average deviation.
🔹 Key Features
Trend Identification
Bullish Trend →
Bearish Trend →
Signal Generation
Visual Enhancements
Colored candles (green for bullish, red for bearish).
Dynamic bands to visualize trend strength.
Alerts
Customizable buy/sell alerts for real-time notifications.
🔹 Usefulness in Trading
✅ Trend Confirmation – Helps confirm trend direction before entering trades.
✅ Reduces False Signals – Uses adaptive bands to filter out noise.
✅ Works Across Timeframes – Effective on intraday, swing, and long-term trading.
✅ Customizable – Adjustable length and multiplier for different market conditions.
🔹 Best Used For
Trend-following strategies (riding strong trends).
Breakout trading (entering when price confirms momentum).
Avoiding choppy markets (since the adaptive bands widen in volatility).

3D Surface Modeling [PhenLabs]📊 3D Surface Modeling
Version: PineScript™ v6
📌 Description
The 3D Surface Modeling indicator revolutionizes technical analysis by generating three-dimensional visualizations of multiple technical indicators across various timeframes. This advanced analytical tool processes and renders complex indicator data through a sophisticated matrix-based calculation system, creating an intuitive 3D surface representation of market dynamics.
The indicator employs array-based computations to simultaneously analyze multiple instances of selected technical indicators, mapping their behavior patterns across different temporal dimensions. This unique approach enables traders to identify complex market patterns and relationships that may be invisible in traditional 2D charts.
🚀 Points of Innovation
Matrix-Based Computation Engine: Processes up to 500 concurrent indicator calculations in real-time
Dynamic 3D Rendering System: Creates depth perception through sophisticated line arrays and color gradients
Multi-Indicator Integration: Seamlessly combines VWAP, Hurst, RSI, Stochastic, CCI, MFI, and Fractal Dimension analyses
Adaptive Scaling Algorithm: Automatically adjusts visualization parameters based on indicator type and market conditions
🔧 Core Components
Indicator Processing Module: Handles real-time calculation of multiple technical indicators using array-based mathematics
3D Visualization Engine: Converts indicator data into three-dimensional surfaces using line arrays and color mapping
Dynamic Scaling System: Implements custom normalization algorithms for different indicator types
Color Gradient Generator: Creates depth perception through programmatic color transitions
🔥 Key Features
Multi-Indicator Support: Comprehensive analysis across seven different technical indicators
Customizable Visualization: User-defined color schemes and line width parameters
Real-time Processing: Continuous calculation and rendering of 3D surfaces
Cross-Timeframe Analysis: Simultaneous visualization of indicator behavior across multiple periods
🎨 Visualization
Surface Plot: Three-dimensional representation using up to 500 lines with dynamic color gradients
Depth Indicators: Color intensity variations showing indicator value magnitude
Pattern Recognition: Visual identification of market structures across multiple timeframes
📖 Usage Guidelines
Indicator Selection
Type: VWAP, Hurst, RSI, Stochastic, CCI, MFI, Fractal Dimension
Default: VWAP
Starting Length: Minimum 5 periods
Default: 10
Step Size: Interval between calculations
Range: 1-10
Visualization Parameters
Color Scheme: Green, Red, Blue options
Line Width: 1-5 pixels
Surface Resolution: Up to 500 lines
✅ Best Use Cases
Multi-timeframe market analysis
Pattern recognition across different technical indicators
Trend strength assessment through 3D visualization
Market behavior study across multiple periods
⚠️ Limitations
High computational resource requirements
Maximum 500 line restriction
Requires substantial historical data
Complex visualization learning curve
🔬 How It Works
1. Data Processing:
Calculates selected indicator values across multiple timeframes
Stores results in multi-dimensional arrays
Applies custom scaling algorithms
2. Visualization Generation:
Creates line arrays for 3D surface representation
Applies color gradients based on value magnitude
Renders real-time updates to surface plot
3. Display Integration:
Synchronizes with chart timeframe
Updates surface plot dynamically
Maintains visual consistency across updates
🌟 Credits:
Inspired by LonesomeTheBlue (modified for multiple indicator types with scaling fixes and additional unique mappings)
💡 Note:
Optimal performance requires sufficient computing resources and historical data. Users should start with default settings and gradually adjust parameters based on their analysis requirements and system capabilities.

Initial Balance Wave MapThis indicator visualizes the Initial Balance (IB) range for any session, marking the first hour's high and low. It includes optional midpoints, extensions (e.g. 1.5x IB, 2x IB), and customizable time windows. Additional features allow users to display session open, high, low, close, and VWAP reference points. Designed to support price action and session structure analysis, it adapts to various global futures and FX market opens. All display elements are optional and fully configurable.
This updated indicator builds upon the open-source foundation by @noop-noop with enhancements and user-facing labels tailored for Auction Market Theory, scalping, and structure-based trade setups.
Key updated Featured: Multiple previous day's IB levels carry forward into the current day's chart, as opposed to just the previous day's levels carrying forward to the new IB time.
🙌 Credits:
This script builds upon the excellent open-source work by @noop-noop. Original script available here .

Customizable ORB BoxCustomizable ORB Box
📘 Description
A powerful and flexible Opening Range Breakout (ORB) visualization tool designed for intraday traders. This indicator plots the opening range using either the first candle or a user-defined custom timeframe, and updates in real time.
🔧 Key Features
First Candle Mode – Plots the high/low range of the first candle of each new trading day.
Custom Timeframe Mode – Builds the ORB box live over a chosen duration (e.g., 5, 15, 30 minutes) and finalizes it after the timeframe completes.
Dynamic Box Colors – Bullish and bearish color themes based on range closure direction.
Multi-Day Plotting – Displays ORB boxes across all days, not just today.
Alerts Included – Triggers when price breaks above or below the ORB range.
No repainting – Stable and historical-friendly behavior.
🕒 ETH Compatibility
This indicator respects your TradingView chart settings:
✅ If ETH is enabled, ORB begins with the first ETH candle.
✅ If ETH is disabled, ORB begins with Regular Trading Hours (RTH).
Tip: Control this via the chart’s ⚙️ “Session” settings for your instrument.
💡 How to Use
Use First Candle Mode for classic ORB strategy setups (quick early structure).
Use Custom Timeframe Mode on smaller timeframes (e.g., 3min) for dynamic range-building.
Combine with volume, VWAP, trendlines, or price action for breakout confirmation.

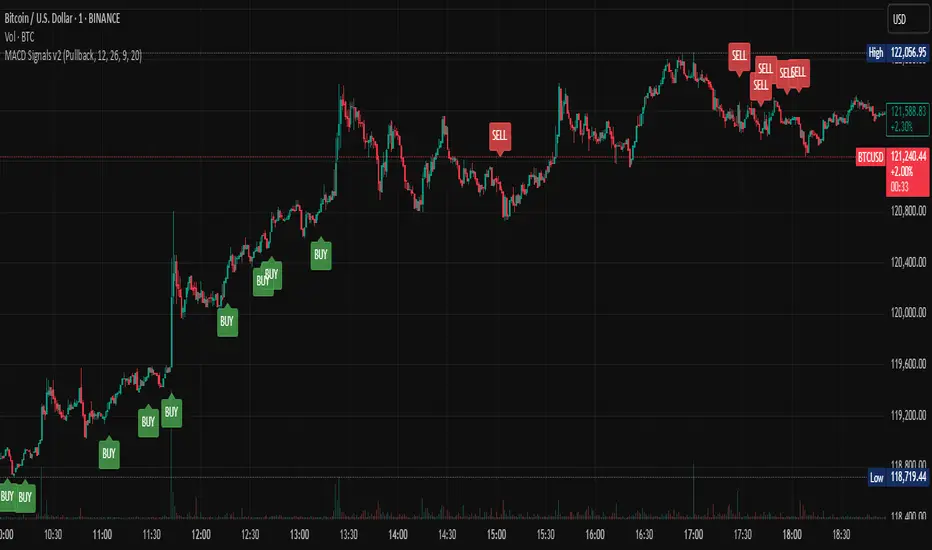
Multi-Mode MACD Signals v2Multi-Mode MACD Signals v2
Signal Types Explained ⚙️
You can now choose your preferred signal from a dropdown menu in the indicator's settings:
Pullback (Default): The original, high-probability strategy. It identifies "buy the dip" and "sell the rally" opportunities within an established trend.
Buy: Triggers on a bullish MACD/Signal line cross above the zero line.
Sell: Triggers on a bearish MACD/Signal line cross below the zero line.
Standard Crossover: The most common MACD signal. It's a pure momentum signal that triggers whenever the MACD line crosses the signal line, regardless of the trend.
Buy: MACD line crosses above the Signal line.
Sell: MACD line crosses below the Signal line.
Zero Line Cross: A trend-change signal. It identifies when the overall momentum shifts from bullish to bearish or vice-versa.
Buy: MACD line crosses above the Zero line.
Sell: MACD line crosses below the Zero line.
How Signals Are Displayed (Real-time vs. Confirmed)
This indicator addresses your request to have signals "display as it occurs" automatically. Here is how it works:
Real-time Alert (As it Occurs): On a live, developing candle, a "BUY" or "SELL" label may appear the instant the MACD conditions are met. This gives you the earliest possible warning.
Signal Repainting: Because the price is still moving within the live candle, the signal may appear and later disappear if the conditions are no longer met by the time the candle closes. This is known as "repainting".
Confirmed Signal: Once the candle closes, the signal is locked in and will never change. This is the confirmed, non-repainting signal.
To create alerts based on these signals, right-click a label on the chart, select "Add alert on Multi-Mode MACD Signals," and choose "Once Per Bar Close" for a confirmed signal or "Once Per Bar" for an earlier, real-time alert.
Pivot Channel LevelsPivot Channel Levels
Indicator Description
“Pivot Channel Levels” is an advanced technical analysis tool that identifies key price pivots (highs and lows) and creates dynamic support and resistance levels based on the wicks of candles at these points (or bodies if wicks are minimal). The indicator analyzes the volume at the time of a pivot’s formation, displaying its value and percentage change relative to the volume’s simple moving average (SMA).
It does not generate buy/sell signals but provides a clear visualization of market structure, helping traders identify potential price reaction zones and assess the strength of market movements.
Why Are Wicks Important?
Candle wicks at price pivots indicate significant market reactions in key areas. Depending on the context, they may signal rejection, testing, or absorption of a support or resistance level. Long wicks often appear where large players are active, and the marked zones are frequently retested. The indicator allows for quick identification and observation of their impact on future price action.
Why Use It?
- Precise Support and Resistance Levels: The indicator draws price channels based on candle wicks at pivots (or bodies if wicks are absent), enabling better identification of zones where price may react.
- Volume Analysis: It shows how the volume at a pivot differs from the average, indicating potential activity by large players or key market moments.
- Visual Clarity: Colored lines, channel fills, and clear labels facilitate quick chart analysis, even on short timeframes.
- Flexibility: Adjustable pivot length, volume average, and label colors allow customization to various trading strategies.
How It Works
- Pivot Detection: Automatically identifies local highs and lows based on the “Pivot Length” parameter (default: 20 candles). This means a pivot appears on the chart with a 20-candle delay. Reducing this value allows faster pivot detection (after fewer candles), increasing their number but potentially generating more noise.
- Channel Creation: Draws support and resistance levels based on the wicks of candles at pivot points (or bodies if wicks are minimal) with a delay to confirm zones. A pivot channel is drawn until the next pivot is identified, but if not previously broken, it remains valid as active support or resistance.
- Volume Analysis: Displays the volume at the pivot’s formation and its percentage change relative to the volume’s SMA.
- Visualization: Pivot and channel levels are shown as lines with fills, and labels display volume and its deviation from the average.
Trading Applications
- Swing Trading: Use pivot levels and channels to identify price reversal points or consolidation zones.
- Scalping: Monitor price reactions to channels on short timeframes, especially with high volume.
- Faster Pivot Identification: Switch to a lower timeframe (e.g., from H1 to M15) to identify pivots more quickly, allowing earlier reactions to price changes.
- Market Context Analysis: High volume at pivots may indicate significant levels likely to be retested.
- Combining with Other Tools: The indicator pairs well with Fibonacci retracement, supply/demand zones, or oscillators like RSI.
Settings and Customization
- Pivot Length: Determines how many candles back and forward are analyzed to detect pivots (default: 20). A smaller value increases sensitivity, a larger one enhances stability.
- Volume Average: Length of the SMA for volume (default: 20). Adjust to better reflect market characteristics.
- Label Colors: Choose colors for bullish and bearish pivot labels to match your chart style.
Usage Examples
- Identifying Key Zones: If the price approaches a pivot level with high volume (e.g., +50% relative to SMA), it may signal strong support or resistance.
- Breakout Confirmation: A channel breakout with high volume can indicate trend continuation.
- Price Reaction Analysis: Long wicks at pivots with high volume may signal level rejection by large players.
Notes for Users
- The indicator performs best on highly liquid markets (e.g., Forex, indices, cryptocurrencies).
- On short timeframes (e.g., M1, M5), it may generate more noise—adjust “Pivot Length” to suit your needs.
- Consider combining with other indicators to confirm signals derived from pivot and volume analysis.

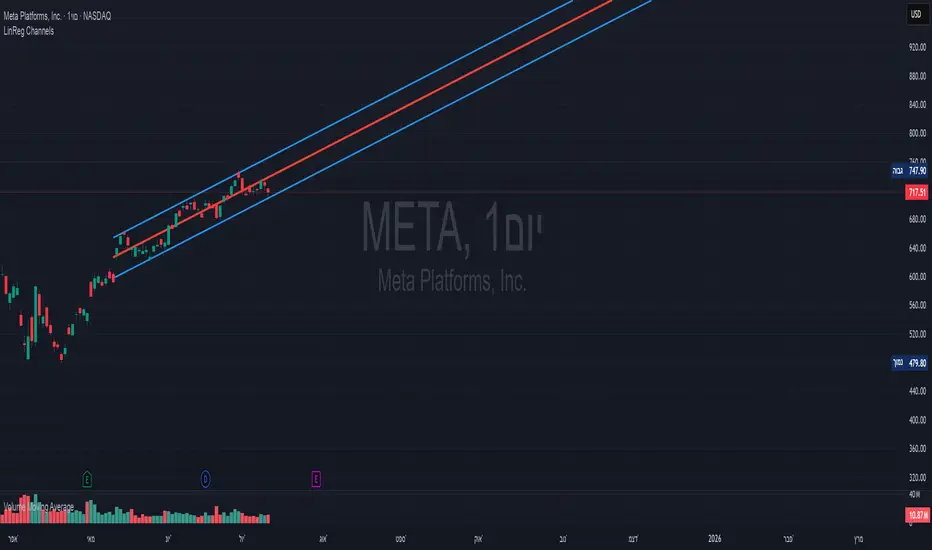
Linear Regression Channels📈 Linear Regression Channels
🌟 Overview
A professional dual linear regression channel indicator designed for comprehensive trend analysis. This powerful tool provides simultaneous short-term and long-term trend perspectives through two independent regression channels with customizable standard deviation bands.
🔧 Core Features
📊 Dual Channel System
Channel 1: 43-period regression analysis for long-term trend identification
Channel 2: 20-period regression analysis for short-term momentum tracking
Independent Configuration: Each channel fully customizable with separate parameters
Real-Time Updates: Dynamic calculations with every new candle
📐 Standard Deviation Bands
Multiple Levels: Configurable deviation bands (1σ, 2σ, 3σ)
Dynamic Support/Resistance: Automatically calculated price levels
Trend Boundaries: Clear visualization of trend strength and direction
Statistical Precision: Mathematically accurate regression calculations
🎨 Customization Options
🎭 Visual Styling
Individual Colors: Separate color schemes for each channel
Line Styles: Choose between Solid, Dashed, or Dotted lines
Line Width: Adjustable thickness (1-5 pixels) for optimal visibility
Extension Options: Project lines into the future for analysis
⚙️ Technical Parameters
Period Length: Fully adjustable lookback periods
Source Selection: Choose from Close, Open, High, Low, or custom sources
Deviation Levels: Customizable standard deviation multipliers
Display Control: Toggle individual channels on/off
📈 Trading Applications
🎯 Trend Analysis
Dual Timeframe Perspective: Simultaneous short and long-term view
Trend Confirmation: When both channels align in direction
Trend Strength: Measured by price position within channels
🔍 Support & Resistance
Dynamic Levels: Standard deviation bands as S/R zones
Channel Boundaries: Natural support and resistance areas
Confluence Trading: Multiple level confirmations
⚡ Entry & Exit Signals
Channel Breakouts: Trend continuation opportunities
Mean Reversion: Trades back to center line
Channel Crossovers: When price moves between timeframes
🚀 Key Benefits
✅ Multi-Timeframe Analysis - Complete market perspective
✅ Mathematical Precision - Least squares regression accuracy
✅ High Customization - Adaptable to any trading style
✅ Clean Interface - Professional chart appearance
✅ Performance Optimized - Smooth real-time operation
✅ Versatile Application - Works on all markets and timeframes
💡 Professional Usage
Combine both channels for confluence signals
Use longer channel for overall trend bias
Trade shorter channel signals within longer trend
Monitor channel width for volatility analysis
Essential tool for traders seeking precise trend analysis and dynamic support/resistance levels.
Turtle Trading System + ATR Trailing StopIndicator Description: Turtle ATR Trailing Stop
The **Turtle ATR Trailing Stop** is a technical indicator designed to enhance the classic Turtle Trading System by incorporating a dynamic trailing stop based on the Average True Range (ATR). This indicator is ideal for traders seeking to manage risk and lock in profits on both long and short positions in trending markets.
Key Features:
- Turtle Trading Levels: Calculates the 20-day highest high and lowest low to identify potential breakout points, a core principle of the Turtle Trading System.
- ATR-Based Trailing Stop: Utilizes a trailing stop that adjusts dynamically based on a multiple of the ATR (default multiplier: 2.0), providing a volatility-adjusted exit mechanism.
- Position Flexibility: Supports both long and short positions, with the trailing stop positioned below the highest price for long trades and above the lowest price for short trades.
- Smooth Updates: The trailing stop updates on each bar, ensuring a more responsive adjustment to price movements, rather than only on new highs or lows.
- Reset Mechanism: Automatically resets the trailing stop when the price deviates significantly (configurable threshold, default 0.1%), adapting to major trend reversals.
- Alerts: Includes customizable alerts that trigger when the price reaches the trailing stop level, notifying traders of potential exit points.
- Debugging Tools: Features an on-chart debug table displaying ATR, Close, Highest Price, Lowest Price, Potential Stop, and Trailing Stop values for real-time analysis.
How It Works:
- For **Long Positions**: The trailing stop starts below the initial close price (minus 2*ATR) and moves up as the highest price increases, locking in profits while trailing at a fixed ATR distance.
- For **Short Positions**: The trailing stop starts above the initial close price (plus 2*ATR) and moves down as the lowest price decreases, protecting against upward price movements.
- The stop resets if the price falls (for long) or rises (for short) beyond the set threshold, ensuring adaptability to new market conditions.
Customization:
- Period Settings: Adjust the length for highs/lows (default 20) and ATR period (default 14).
- ATR Multiplier: Modify the distance of the trailing stop (default 2.0).
- Reset Threshold: Fine-tune the percentage at which the stop resets (default 0.1%).
- Position Type: Switch between "Long" and "Short" modes via input settings.
Usage:
Apply this indicator to any chart in TradingView, set your preferred parameters, and monitor the trailing stop line (yellow) alongside the Turtle highs (red) and lows (blue). Use the debug table to validate calculations and set alerts to stay informed of stop triggers.
This indicator combines the trend-following strength of the Turtle System with a flexible, ATR-based stop-loss strategy, making it a powerful tool for both manual and automated trading strategies.
