SMC Structures and FVGสวัสดีครับ! ผมจะอธิบายอินดิเคเตอร์ "SMC Structures and FVG + MACD" ที่คุณให้มาอย่างละเอียดในแต่ละส่วน เพื่อให้คุณเข้าใจการทำงานของมันอย่างถ่องแท้ครับ
อินดิเคเตอร์นี้เป็นการผสมผสานแนวคิดของ Smart Money Concept (SMC) ซึ่งเน้นการวิเคราะห์โครงสร้างตลาด (Market Structure) และ Fair Value Gap (FVG) เข้ากับอินดิเคเตอร์ MACD เพื่อใช้เป็นตัวกรองหรือตัวยืนยันสัญญาณ Choch/BoS (Change of Character / Break of Structure)
1. ภาพรวมอินดิเคเตอร์ (Overall Purpose)
อินดิเคเตอร์นี้มีจุดประสงค์หลักคือ:
ระบุโครงสร้างตลาด: ตีเส้นและป้ายกำกับ Choch (Change of Character) และ BoS (Break of Structure) บนกราฟโดยอัตโนมัติ
ผสานการยืนยันด้วย MACD: สัญญาณ Choch/BoS จะถูกพิจารณาก็ต่อเมื่อ MACD Histogram เกิดการตัดขึ้นหรือลง (Zero Cross) ในทิศทางที่สอดคล้องกัน
แสดง Fair Value Gap (FVG): หากเปิดใช้งาน จะมีการตีกล่อง FVG บนกราฟ
แสดงระดับ Fibonacci: คำนวณและแสดงระดับ Fibonacci ที่สำคัญตามโครงสร้างตลาดปัจจุบัน
ปรับตาม Timeframe: การคำนวณและการแสดงผลทั้งหมดจะปรับตาม Timeframe ที่คุณกำลังใช้งานอยู่โดยอัตโนมัติ
2. ส่วนประกอบหลักของโค้ด (Code Breakdown)
โค้ดนี้สามารถแบ่งออกเป็นส่วนหลัก ๆ ได้ดังนี้:
2.1 Inputs (การตั้งค่า)
ส่วนนี้คือตัวแปรที่คุณสามารถปรับแต่งได้ในหน้าต่างการตั้งค่าของอินดิเคเตอร์ (คลิกที่รูปฟันเฟืองข้างชื่ออินดิเคเตอร์บนกราฟ)
MACD Settings (ตั้งค่า MACD):
fast_len: ความยาวของ Fast EMA สำหรับ MACD (ค่าเริ่มต้น 12)
slow_len: ความยาวของ Slow EMA สำหรับ MACD (ค่าเริ่มต้น 26)
signal_len: ความยาวของ Signal Line สำหรับ MACD (ค่าเริ่มต้น 9)
= ta.macd(close, fast_len, slow_len, signal_len): คำนวณค่า MACD Line, Signal Line และ Histogram โดยใช้ราคาปิด (close) และค่าความยาวที่กำหนด
is_bullish_macd_cross: ตรวจสอบว่า MACD Histogram ตัดขึ้นเหนือเส้น 0 (จากค่าลบเป็นบวก)
is_bearish_macd_cross: ตรวจสอบว่า MACD Histogram ตัดลงใต้เส้น 0 (จากค่าบวกเป็นลบ)
Fear Value Gap (FVG) Settings:
isFvgToShow: (Boolean) เปิด/ปิดการแสดง FVG บนกราฟ
bullishFvgColor: สีสำหรับ Bullish FVG
bearishFvgColor: สีสำหรับ Bearish FVG
mitigatedFvgColor: สีสำหรับ FVG ที่ถูก Mitigate (ลดทอน) แล้ว
fvgHistoryNbr: จำนวน FVG ย้อนหลังที่จะแสดง
isMitigatedFvgToReduce: (Boolean) เปิด/ปิดการลดขนาด FVG เมื่อถูก Mitigate
Structures (โครงสร้างตลาด) Settings:
isStructBodyCandleBreak: (Boolean) หากเป็น true การ Break จะต้องเกิดขึ้นด้วย เนื้อเทียน ที่ปิดเหนือ/ใต้ Swing High/Low หากเป็น false แค่ไส้เทียนทะลุก็ถือว่า Break
isCurrentStructToShow: (Boolean) เปิด/ปิดการแสดงเส้นโครงสร้างตลาดปัจจุบัน (เส้นสีน้ำเงินในภาพตัวอย่าง)
pivot_len: ความยาวของแท่งเทียนที่ใช้ในการมองหาจุด Pivot (Swing High/Low) ยิ่งค่าน้อยยิ่งจับ Swing เล็กๆ ได้, ยิ่งค่ามากยิ่งจับ Swing ใหญ่ๆ ได้
bullishBosColor, bearishBosColor: สีสำหรับเส้นและป้าย BOS ขาขึ้น/ขาลง
bosLineStyleOption, bosLineWidth: สไตล์ (Solid, Dotted, Dashed) และความหนาของเส้น BOS
bullishChochColor, bearishChochColor: สีสำหรับเส้นและป้าย CHoCH ขาขึ้น/ขาลง
chochLineStyleOption, chochLineWidth: สไตล์ (Solid, Dotted, Dashed) และความหนาของเส้น CHoCH
currentStructColor, currentStructLineStyleOption, currentStructLineWidth: สี, สไตล์ และความหนาของเส้นโครงสร้างตลาดปัจจุบัน
structHistoryNbr: จำนวนการ Break (Choch/BoS) ย้อนหลังที่จะแสดง
Structure Fibonacci (จากโค้ดต้นฉบับ):
เป็นชุด Input สำหรับเปิด/ปิด, กำหนดค่า, สี, สไตล์ และความหนาของเส้น Fibonacci Levels ต่างๆ (0.786, 0.705, 0.618, 0.5, 0.382) ที่จะถูกคำนวณจากโครงสร้างตลาดปัจจุบัน
2.2 Helper Functions (ฟังก์ชันช่วยทำงาน)
getLineStyle(lineOption): ฟังก์ชันนี้ใช้แปลงค่า String ที่เลือกจาก Input (เช่น "─", "┈", "╌") ให้เป็นรูปแบบ line.style_ ที่ Pine Script เข้าใจ
get_structure_highest_bar(lookback): ฟังก์ชันนี้พยายามหา Bar Index ของแท่งเทียนที่ทำ Swing High ภายในช่วง lookback ที่กำหนด
get_structure_lowest_bar(lookback): ฟังก์ชันนี้พยายามหา Bar Index ของแท่งเทียนที่ทำ Swing Low ภายในช่วง lookback ที่กำหนด
is_structure_high_broken(...): ฟังก์ชันนี้ตรวจสอบว่าราคาปัจจุบันได้ Break เหนือ _structureHigh (Swing High) หรือไม่ โดยพิจารณาจาก _highStructBreakPrice (ราคาปิดหรือราคา High ขึ้นอยู่กับการตั้งค่า isStructBodyCandleBreak)
FVGDraw(...): ฟังก์ชันนี้รับ Arrays ของ FVG Boxes, Types, Mitigation Status และ Labels มาประมวลผล เพื่ออัปเดตสถานะของ FVG (เช่น ถูก Mitigate หรือไม่) และปรับขนาด/ตำแหน่งของ FVG Box และ Label บนกราฟ
2.3 Global Variables (ตัวแปรทั่วทั้งอินดิเคเตอร์)
เป็นตัวแปรที่ประกาศด้วย var ซึ่งหมายความว่าค่าของมันจะถูกเก็บไว้และอัปเดตในแต่ละแท่งเทียน (persists across bars)
structureLines, structureLabels: Arrays สำหรับเก็บอ็อบเจกต์ line และ label ของเส้น Choch/BoS ที่วาดบนกราฟ
fvgBoxes, fvgTypes, fvgLabels, isFvgMitigated: Arrays สำหรับเก็บข้อมูลของ FVG Boxes และสถานะต่างๆ
structureHigh, structureLow: เก็บราคาของ Swing High/Low ที่สำคัญของโครงสร้างตลาดปัจจุบัน
structureHighStartIndex, structureLowStartIndex: เก็บ Bar Index ของจุดเริ่มต้นของ Swing High/Low ที่สำคัญ
structureDirection: เก็บสถานะของทิศทางโครงสร้างตลาด (1 = Bullish, 2 = Bearish, 0 = Undefined)
fiboXPrice, fiboXStartIndex, fiboXLine, fiboXLabel: ตัวแปรสำหรับเก็บข้อมูลและอ็อบเจกต์ของเส้น Fibonacci Levels
isBOSAlert, isCHOCHAlert: (Boolean) ใช้สำหรับส่งสัญญาณ Alert (หากมีการตั้งค่า Alert ไว้)
2.4 FVG Processing (การประมวลผล FVG)
ส่วนนี้จะตรวจสอบเงื่อนไขการเกิด FVG (Bullish FVG: high < low , Bearish FVG: low > high )
หากเกิด FVG และ isFvgToShow เป็น true จะมีการสร้าง box และ label ใหม่เพื่อแสดง FVG บนกราฟ
มีการจัดการ fvgBoxes และ fvgLabels เพื่อจำกัดจำนวน FVG ที่แสดงตาม fvgHistoryNbr และลบ FVG เก่าออก
ฟังก์ชัน FVGDraw จะถูกเรียกเพื่ออัปเดตสถานะของ FVG (เช่น การถูก Mitigate) และปรับการแสดงผล
2.5 Structures Processing (การประมวลผลโครงสร้างตลาด)
Initialization: ที่ bar_index == 0 (แท่งเทียนแรกของกราฟ) จะมีการกำหนดค่าเริ่มต้นให้กับ structureHigh, structureLow, structureHighStartIndex, structureLowStartIndex
Finding Current High/Low: highest, highestBar, lowest, lowestBar ถูกใช้เพื่อหา High/Low ที่สุดและ Bar Index ของมันใน 10 แท่งล่าสุด (หรือทั้งหมดหากกราฟสั้นกว่า 10 แท่ง)
Calculating Structure Max/Min Bar: structureMaxBar และ structureMinBar ใช้ฟังก์ชัน get_structure_highest_bar และ get_structure_lowest_bar เพื่อหา Bar Index ของ Swing High/Low ที่แท้จริง (ไม่ใช่แค่ High/Low ที่สุดใน lookback แต่เป็นจุด Pivot ที่สมบูรณ์)
Break Price: lowStructBreakPrice และ highStructBreakPrice จะเป็นราคาปิด (close) หรือราคา Low/High ขึ้นอยู่กับ isStructBodyCandleBreak
isStuctureLowBroken / isStructureHighBroken: เงื่อนไขเหล่านี้ตรวจสอบว่าราคาได้ทำลาย structureLow หรือ structureHigh หรือไม่ โดยพิจารณาจากราคา Break, ราคาแท่งก่อนหน้า และ Bar Index ของจุดเริ่มต้นโครงสร้าง
Choch/BoS Logic (ส่วนสำคัญที่ถูกผสานกับ MACD):
if(isStuctureLowBroken and is_bearish_macd_cross): นี่คือจุดที่ MACD เข้ามามีบทบาท หากราคาทำลาย structureLow (สัญญาณขาลง) และ MACD Histogram เกิด Bearish Zero Cross (is_bearish_macd_cross เป็น true) อินดิเคเตอร์จะพิจารณาว่าเป็น Choch หรือ BoS
หาก structureDirection == 1 (เดิมเป็นขาขึ้น) หรือ 0 (ยังไม่กำหนด) จะตีเป็น "CHoCH" (เปลี่ยนทิศทางโครงสร้างเป็นขาลง)
หาก structureDirection == 2 (เดิมเป็นขาลง) จะตีเป็น "BOS" (ยืนยันโครงสร้างขาลง)
มีการสร้าง line.new และ label.new เพื่อวาดเส้นและป้ายกำกับ
structureDirection จะถูกอัปเดตเป็น 1 (Bullish)
structureHighStartIndex, structureLowStartIndex, structureHigh, structureLow จะถูกอัปเดตเพื่อกำหนดโครงสร้างใหม่
else if(isStructureHighBroken and is_bullish_macd_cross): เช่นกันสำหรับขาขึ้น หากราคาทำลาย structureHigh (สัญญาณขาขึ้น) และ MACD Histogram เกิด Bullish Zero Cross (is_bullish_macd_cross เป็น true) อินดิเคเตอร์จะพิจารณาว่าเป็น Choch หรือ BoS
หาก structureDirection == 2 (เดิมเป็นขาลง) หรือ 0 (ยังไม่กำหนด) จะตีเป็น "CHoCH" (เปลี่ยนทิศทางโครงสร้างเป็นขาขึ้น)
หาก structureDirection == 1 (เดิมเป็นขาขึ้น) จะตีเป็น "BOS" (ยืนยันโครงสร้างขาขึ้น)
มีการสร้าง line.new และ label.new เพื่อวาดเส้นและป้ายกำกับ
structureDirection จะถูกอัปเดตเป็น 2 (Bearish)
structureHighStartIndex, structureLowStartIndex, structureHigh, structureLow จะถูกอัปเดตเพื่อกำหนดโครงสร้างใหม่
การลบเส้นเก่า: d.delete_line (หากไลบรารีทำงาน) จะถูกเรียกเพื่อลบเส้นและป้ายกำกับเก่าออกเมื่อจำนวนเกิน structHistoryNbr
Updating Structure High/Low (else block): หากไม่มีการ Break เกิดขึ้น แต่ราคาปัจจุบันสูงกว่า structureHigh หรือต่ำกว่า structureLow ในทิศทางที่สอดคล้องกัน (เช่น ยังคงเป็นขาขึ้นและทำ High ใหม่) structureHigh หรือ structureLow จะถูกอัปเดตเพื่อติดตาม High/Low ที่สุดของโครงสร้างปัจจุบัน
Current Structure Display:
หาก isCurrentStructToShow เป็น true อินดิเคเตอร์จะวาดเส้น structureHighLine และ structureLowLine เพื่อแสดงขอบเขตของโครงสร้างตลาดปัจจุบัน
Fibonacci Display:
หาก isFiboXToShow เป็น true อินดิเคเตอร์จะคำนวณและวาดเส้น Fibonacci Levels ต่างๆ (0.786, 0.705, 0.618, 0.5, 0.382) โดยอิงจาก structureHigh และ structureLow ของโครงสร้างตลาดปัจจุบัน
Alerts:
alertcondition: ใช้สำหรับตั้งค่า Alert ใน TradingView เมื่อเกิดสัญญาณ BOS หรือ CHOCH
plot(na):
plot(na) เป็นคำสั่งที่สำคัญในอินดิเคเตอร์ที่ไม่ได้ต้องการพล็อต Series ของข้อมูลบนกราฟ (เช่น ไม่ได้พล็อตเส้น EMA หรือ RSI) แต่ใช้วาดอ็อบเจกต์ (Line, Label, Box) โดยตรง
การมี plot(na) ช่วยให้ Pine Script รู้ว่าอินดิเคเตอร์นี้มีเอาต์พุตที่แสดงผลบนกราฟ แม้ว่าจะไม่ได้เป็น Series ที่พล็อตตามปกติก็ตาม
3. วิธีใช้งาน
คัดลอกโค้ดทั้งหมด ที่อยู่ในบล็อก immersive ด้านบน
ไปที่ TradingView และเปิดกราฟที่คุณต้องการ
คลิกที่เมนู "Pine Editor" ที่อยู่ด้านล่างของหน้าจอ
ลบโค้ดเดิมที่มีอยู่ และ วางโค้ดที่คัดลอกมา ลงไปแทน
คลิกที่ปุ่ม "Add to Chart"
อินดิเคเตอร์จะถูกเพิ่มลงในกราฟของคุณโดยอัตโนมัติ คุณสามารถคลิกที่รูปฟันเฟืองข้างชื่ออินดิเคเตอร์บนกราฟเพื่อเข้าถึงหน้าต่างการตั้งค่าและปรับแต่งตามความต้องการของคุณได้
Hello! I will explain the "SMC Structures and FVG + MACD" indicator you provided in detail, section by section, so you can fully understand how it works.This indicator combines the concepts of Smart Money Concept (SMC), which focuses on analyzing Market Structure and Fair Value Gaps (FVG), with the MACD indicator to serve as a filter or confirmation for Choch (Change of Character) and BoS (Break of Structure) signals.1. Overall PurposeThe main purposes of this indicator are:Identify Market Structure: Automatically draw lines and label Choch (Change of Character) and BoS (Break of Structure) on the chart.Integrate MACD Confirmation: Choch/BoS signals will only be considered when the MACD Histogram performs a cross (Zero Cross) in the corresponding direction.Display Fair Value Gap (FVG): If enabled, FVG boxes will be drawn on the chart.Display Fibonacci Levels: Calculate and display important Fibonacci levels based on the current market structure.Adapt to Timeframe: All calculations and displays will automatically adjust to the timeframe you are currently using.2. Code BreakdownThis code can be divided into the following main sections:2.1 Inputs (Settings)This section contains variables that you can adjust in the indicator's settings window (click the gear icon next to the indicator's name on the chart).MACD Settings:fast_len: Length of the Fast EMA for MACD (default 12)slow_len: Length of the Slow EMA for MACD (default 26)signal_len: Length of the Signal Line for MACD (default 9) = ta.macd(close, fast_len, slow_len, signal_len): Calculates the MACD Line, Signal Line, and Histogram using the closing price (close) and the specified lengths.is_bullish_macd_cross: Checks if the MACD Histogram crosses above the 0 line (from negative to positive).is_bearish_macd_cross: Checks if the MACD Histogram crosses below the 0 line (from positive to negative).Fear Value Gap (FVG) Settings:isFvgToShow: (Boolean) Enables/disables the display of FVG on the chart.bullishFvgColor: Color for Bullish FVG.bearishFvgColor: Color for Bearish FVG.mitigatedFvgColor: Color for FVG that has been mitigated.fvgHistoryNbr: Number of historical FVG to display.isMitigatedFvgToReduce: (Boolean) Enables/disables reducing the size of FVG when mitigated.Structures (โครงสร้างตลาด) Settings:isStructBodyCandleBreak: (Boolean) If true, the break must occur with the candle body closing above/below the Swing High/Low. If false, a wick break is sufficient.isCurrentStructToShow: (Boolean) Enables/disables the display of the current market structure lines (blue lines in the example image).pivot_len: Lookback length for identifying Pivot points (Swing High/Low). A smaller value captures smaller, more frequent swings; a larger value captures larger, more significant swings.bullishBosColor, bearishBosColor: Colors for bullish/bearish BOS lines and labels.bosLineStyleOption, bosLineWidth: Style (Solid, Dotted, Dashed) and width of BOS lines.bullishChochColor, bearishChochColor: Colors for bullish/bearish CHoCH lines and labels.chochLineStyleOption, chochLineWidth: Style (Solid, Dotted, Dashed) and width of CHoCH lines.currentStructColor, currentStructLineStyleOption, currentStructLineWidth: Color, style, and width of the current market structure lines.structHistoryNbr: Number of historical breaks (Choch/BoS) to display.Structure Fibonacci (from original code):A set of inputs to enable/disable, define values, colors, styles, and widths for various Fibonacci Levels (0.786, 0.705, 0.618, 0.5, 0.382) that will be calculated from the current market structure.2.2 Helper FunctionsgetLineStyle(lineOption): This function converts the selected string input (e.g., "─", "┈", "╌") into a line.style_ format understood by Pine Script.get_structure_highest_bar(lookback): This function attempts to find the Bar Index of the Swing High within the specified lookback period.get_structure_lowest_bar(lookback): This function attempts to find the Bar Index of the Swing Low within the specified lookback period.is_structure_high_broken(...): This function checks if the current price has broken above _structureHigh (Swing High), considering _highStructBreakPrice (closing price or high price depending on isStructBodyCandleBreak setting).FVGDraw(...): This function takes arrays of FVG Boxes, Types, Mitigation Status, and Labels to process and update the status of FVG (e.g., whether it's mitigated) and adjust the size/position of FVG Boxes and Labels on the chart.2.3 Global VariablesThese are variables declared with var, meaning their values are stored and updated on each bar (persists across bars).structureLines, structureLabels: Arrays to store line and label objects for Choch/BoS lines drawn on the chart.fvgBoxes, fvgTypes, fvgLabels, isFvgMitigated: Arrays to store FVG box data and their respective statuses.structureHigh, structureLow: Stores the price of the significant Swing High/Low of the current market structure.structureHighStartIndex, structureLowStartIndex: Stores the Bar Index of the start point of the significant Swing High/Low.structureDirection: Stores the status of the market structure direction (1 = Bullish, 2 = Bearish, 0 = Undefined).fiboXPrice, fiboXStartIndex, fiboXLine, fiboXLabel: Variables to store data and objects for Fibonacci Levels.isBOSAlert, isCHOCHAlert: (Boolean) Used to trigger alerts in TradingView (if alerts are configured).2.4 FVG ProcessingThis section checks the conditions for FVG formation (Bullish FVG: high < low , Bearish FVG: low > high ).If FVG occurs and isFvgToShow is true, a new box and label are created to display the FVG on the chart.fvgBoxes and fvgLabels are managed to limit the number of FVG displayed according to fvgHistoryNbr and remove older FVG.The FVGDraw function is called to update the FVG status (e.g., whether it's mitigated) and adjust its display.2.5 Structures ProcessingInitialization: At bar_index == 0 (the first bar of the chart), structureHigh, structureLow, structureHighStartIndex, and structureLowStartIndex are initialized.Finding Current High/Low: highest, highestBar, lowest, lowestBar are used to find the highest/lowest price and its Bar Index of it in the last 10 bars (or all bars if the chart is shorter than 10 bars).Calculating Structure Max/Min Bar: structureMaxBar and structureMinBar use get_structure_highest_bar and get_structure_lowest_bar functions to find the Bar Index of the true Swing High/Low (not just the highest/lowest in the lookback but a complete Pivot point).Break Price: lowStructBreakPrice and highStructBreakPrice will be the closing price (close) or the Low/High price, depending on the isStructBodyCandleBreak setting.isStuctureLowBroken / isStructureHighBroken: These conditions check if the price has broken structureLow or structureHigh, considering the break price, previous bar prices, and the Bar Index of the structure's starting point.Choch/BoS Logic (Key Integration with MACD):if(isStuctureLowBroken and is_bearish_macd_cross): This is where MACD plays a role. If the price breaks structureLow (bearish signal) AND the MACD Histogram performs a Bearish Zero Cross (is_bearish_macd_cross is true), the indicator will consider it a Choch or BoS.If structureDirection == 1 (previously bullish) or 0 (undefined), it will be labeled "CHoCH" (changing structure direction to bearish).If structureDirection == 2 (already bearish), it will be labeled "BOS" (confirming bearish structure).line.new and label.new are used to draw the line and label.structureDirection will be updated to 1 (Bullish).structureHighStartIndex, structureLowStartIndex, structureHigh, structureLow will be updated to define the new structure.else if(isStructureHighBroken and is_bullish_macd_cross): Similarly for bullish breaks. If the price breaks structureHigh (bullish signal) AND the MACD Histogram performs a Bullish Zero Cross (is_bullish_macd_cross is true), the indicator will consider it a Choch or BoS.If structureDirection == 2 (previously bearish) or 0 (undefined), it will be labeled "CHoCH" (changing structure direction to bullish).If structureDirection == 1 (already bullish), it will be labeled "BOS" (confirming bullish structure).line.new and label.new are used to draw the line and label.structureDirection will be updated to 2 (Bearish).structureHighStartIndex, structureLowStartIndex, structureHigh, structureLow will be updated to define the new structure.Deleting Old Lines: d.delete_line (if the library works) will be called to delete old lines and labels when their number exceeds structHistoryNbr.Updating Structure High/Low (else block): If no break occurs, but the current price is higher than structureHigh or lower than structureLow in the corresponding direction (e.g., still bullish and making a new high), structureHigh or structureLow will be updated to track the highest/lowest point of the current structure.Current Structure Display:If isCurrentStructToShow is true, the indicator draws structureHighLine and structureLowLine to show the boundaries of the current market structure.Fibonacci Display:If isFiboXToShow is true, the indicator calculates and draws various Fibonacci Levels (0.786, 0.705, 0.618, 0.5, 0.382) based on the structureHigh and structureLow of the current market structure.Alerts:alertcondition: Used to set up alerts in TradingView when BOS or CHOCH signals occur.plot(na):plot(na) is an important statement in indicators that do not plot data series directly on the chart (e.g., not plotting EMA or RSI lines) but instead draw objects (Line, Label, Box).Having plot(na) helps Pine Script recognize that this indicator has an output displayed on the chart, even if it's not a regularly plotted series.3. How to UseCopy all the code in the immersive block above.Go to TradingView and open your desired chart.Click on the "Pine Editor" menu at the bottom of the screen.Delete any existing code and paste the copied code in its place.Click the "Add to Chart" button.The indicator will be added to your chart automatically. You can click the gear icon next to the indicator's name on the chart to access the settings window and customize it to your needs.I hope this explanation helps you understand this indicator in detail. If anything is unclear, or you need further adjustments, please let me know.
Bill Williams Indicators

Vaelion's IndicatorChart is about to show you weekly chart
so you can make weekly indicator not just this old one

Trend Detector by Mr. Posman//@version=5
indicator("Trend Detector by Mr. Posman", overlay=true)
// EMA Parameters
fastLen = input.int(9, title="Fast EMA")
slowLen = input.int(21, title="Slow EMA")
src = close
// Hitung EMA
fastEMA = ta.ema(src, fastLen)
slowEMA = ta.ema(src, slowLen)
// Deteksi trend
uptrend = fastEMA > slowEMA
downtrend = fastEMA < slowEMA
// Tampilkan teks status trend
trendLabel = uptrend ? "📈 Uptrend" : downtrend ? "📉 Downtrend" : "⏸ Sideways"
labelColor = uptrend ? color.lime : downtrend ? color.red : color.gray
// Plot label di atas chart
var label trendStatus = label.new(x=bar_index, y=high, text=trendLabel, style=label.style_label_down, color=labelColor, textcolor=color.white)
label.set_xy(trendStatus, bar_index, high)
label.set_text(trendStatus, trendLabel)
label.set_color(trendStatus, labelColor)
// Warna background chart
bgcolor(uptrend ? color.new(color.green, 85) : downtrend ? color.new(color.red, 85) : na)
// Plot EMA (opsional)
plot(fastEMA, color=color.green, title="Fast EMA")
plot(slowEMA, color=color.orange, title="Slow EMA")

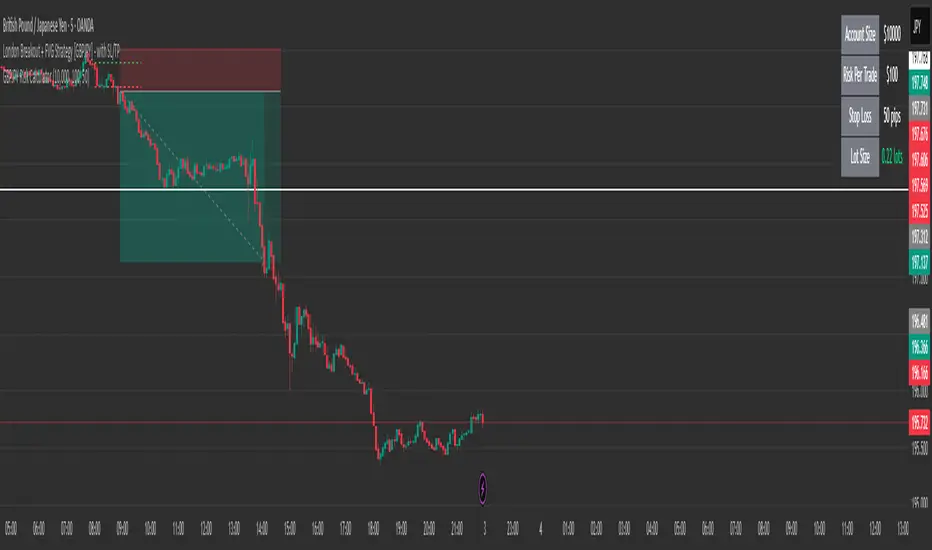
Guaranteed Working EMA Crossover StrategyThis is a clean, backtestable trend-following strategy that uses a Fast and Slow EMA crossover to identify market momentum. It includes a built-in Stop Loss (SL) in pips and a Risk-to-Reward (RR) based Take Profit (TP) system to help control risk and lock in profits.
Ideal for assets like XAUUSD (Gold), BTCUSD (Bitcoin), and major Forex pairs, this strategy suits both intraday and swing traders who want clear entries and exits with easy-to-adjust parameters.
🔍 How It Works
✅ Long Entry:
Fast EMA crosses above Slow EMA (bullish signal)
Candle closes above both EMAs
SL is set a fixed number of pips below entry price
TP is set based on RR (default 1:2)
❌ Short Entry:
Fast EMA crosses below Slow EMA (bearish signal)
Candle closes below both EMAs
SL is set a fixed number of pips above entry
TP is calculated using RR
⚙️ Inputs (Fully Editable):
Fast EMA = 9
Slow EMA = 21
Stop Loss (pips) = 100
Risk:Reward Ratio = 2.0
📈 Visuals & Results:
Green Line = Fast EMA
Red Line = Slow EMA
Buy/Sell trades shown clearly
Full reports appear under Strategy Tester: win rate, profit, drawdown
💼 Best Used On:
Assets: XAUUSD, BTCUSD, EURUSD, NAS100, US30, GBPJPY
Timeframes: 15min, 1H, 4H
Market Type: Trending conditions (not sideways)
⚠️ Disclaimer:
This strategy is provided for educational and research purposes only. It does not constitute financial advice or a trading signal.
Trading carries risk, and past performance does not guarantee future results.
You are solely responsible for your trades. Always test and validate strategies on a demo account before applying to real capital.

Squeeze Momentum [No Error Version] by Mr. Posman//@version=5
indicator("Squeeze Momentum by Mr. Posman", overlay=false)
// Input Parameters
length = input.int(20, title="SMA Length")
multBB = input.float(2.0, title="Bollinger Band Multiplier")
multKC = input.float(1.5, title="Keltner Channel Multiplier")
// Source Data
src = close
// Bollinger Bands
basis = ta.sma(src, length)
dev = multBB * ta.stdev(src, length)
upperBB = basis + dev
lowerBB = basis - dev
// Keltner Channels (rename variable to avoid 'range' error)
atrLike = ta.ema(high - low, length)
upperKC = basis + multKC * atrLike
lowerKC = basis - multKC * atrLike
// Squeeze Conditions
squeezeOn = (lowerBB > lowerKC and upperBB < upperKC) // BB inside KC = Squeeze On
squeezeOff = (lowerBB < lowerKC and upperBB > upperKC) // BB outside KC = Squeeze Off
// Momentum Calculation (Linear Regression)
momentum = ta.linreg(src - ta.sma(src, length), length, 0)
// Plot Histogram
histColor = momentum > 0 ?
(momentum > nz(momentum ) ? color.lime : color.green) :
(momentum < nz(momentum ) ? color.red : color.maroon)
plot(momentum, title="Momentum Histogram", style=plot.style_columns, color=histColor, linewidth=2)
// Plot Dots for Squeeze
plotshape(squeezeOn, title="Squeeze On", location=location.bottom, color=color.red, style=shape.circle, size=size.small)
plotshape(squeezeOff, title="Squeeze Off", location=location.bottom, color=color.green, style=shape.circle, size=size.small)

Manadi Buy/Sell Strategy EMA + MACD + RSI + AlertsIt is a strategy / indicator of buy and sell special crypto for 15 min to 1 h time frame.
used with RSI, Macd, and Ema cros 9/21

XAUUSD MA Crossover + RSI StrategyThis is a custom-built TradingView strategy for XAUUSD using Moving Average crossover + RSI confirmation. It’s designed for clean momentum-based entries — no Break of Structure (BOS), no Smart Money Concept (SMC). Just trend and price action logic.
---
⚙️ Strategy Logic
🔹 Buy Entry:
EMA(9) crosses above EMA(21)
RSI(14) is below 70 (not overbought)
🔹 Sell Entry:
EMA(9) crosses below EMA(21)
RSI(14) is above 30 (not oversold)
🔹 Exit:
Take Profit: 200 pips
Stop Loss: 100 pips
Risk-to-reward: 2:1
---
🔎 How to Use This Strategy
This works best on 15min – 1hr timeframe during London & New York session volatility. Avoid flat or ranging sessions. Backtest on multiple gold sessions to filter fakeouts.
Use it for:
Clean trend continuation entries
Learning strategy structure without complex SMC logic
Building your own Pine Script logic as a beginner
---
📉 Backtest Info
Built for XAUUSD but can be adapted for other high-volatility pairs. Works cleanly in trending environments.
Modify MA or RSI periods based on your setup. For higher precision, consider adjusting SL/TP for different timeframes.
---
📌 Disclaimer
> ⚠️ This strategy is for educational purposes only. Past performance does not guarantee future results. Always use proper risk management and test before live trading.

XAUUSD Engulfing Reversal StrategyThis is a custom-built TradingView strategy for XAUUSD (Gold) that uses pure price action — specifically Engulfing Candlestick Patterns at key Support/Resistance zones — to catch reversal trades. It doesn’t rely on BOS, indicators, or Smart Money Concepts (SMC). Just clean, visual, and proven candle logic.
This strategy is ideal for traders who want simple and readable logic for scalping or swing entries without confusing structures.
---
⚙️ Strategy Logic
📌 BUY Conditions:
A bullish engulfing candle appears (current candle closes above its open and fully engulfs previous candle’s body)
Price is close to a dynamic support zone
📌 SELL Conditions:
A bearish engulfing candle appears (current candle closes below its open and fully engulfs previous candle’s body)
Price is near a resistance zone
📌 Exit Conditions:
Take Profit: 300 pips
Stop Loss: 150 pips
Risk-to-Reward: 1:2
This fixed TP/SL setup makes the strategy risk-controlled, clean, and highly backtestable across different market conditions.
---
🔍 How the Strategy Works
This script looks for high-probability reversal setups on gold by detecting strong engulfing candles around historical price zones.
The Support/Resistance zones are automatically calculated using the lowest low / highest high over a defined period (20 candles default). These zones act as key levels where price is likely to react.
When a strong engulfing candle appears near these zones, the strategy assumes a possible reversal is starting and enters a trade in the direction of the engulfing candle.
This logic filters out weak trades and keeps entries simple and logical.
---
⏱️ Timeframe Recommendations
✅ 15-Minutes
✅ 30-Minutes
✅ 1-Hour
These intraday timeframes work best for this type of reversal setup. Higher timeframes (4H, 1D) may be used but will have fewer trades.
Best results come during London and New York session overlaps when gold shows volatility and respects SR zones more consistently.
---
🧪 Backtesting Suggestions
You can easily backtest this on TradingView:
Adjust the lookback period for SR zones to be more/less reactive
Try using dynamic pip settings based on ATR for SL/TP
Combine with a filter like session time to improve accuracy
Add alert conditions for automation (optional)
This logic can also be used for manual entries or built into a Telegram signal bot.
---
⚠️ Disclaimer
> This strategy is for educational and testing purposes only.
It is not financial advice.
Trading carries risk. Always use proper risk management and test thoroughly before using on live accounts.

Rebound Signal BTC by Mas Posman//@version=5
indicator("Rebound Signal BTC by Mas Posman", overlay=true)
// === INPUT ===
fastLen = input.int(12, title="MACD Fast Length")
slowLen = input.int(26, title="MACD Slow Length")
signalLen = input.int(9, title="MACD Signal Smoothing")
rsiLen = input.int(14, title="RSI Length")
volMultiplier = input.float(1.5, title="Volume Spike Multiplier")
// === MACD ===
= ta.macd(close, fastLen, slowLen, signalLen)
macdBullishCross = ta.crossover(macdLine, signalLine)
// === RSI ===
rsi = ta.rsi(close, rsiLen)
rsiOversold = rsi < 30
rsiRecovering = ta.crossover(rsi, 30)
// === Volume ===
volMa = ta.sma(volume, 20)
volSpike = volume > volMa * volMultiplier
// === REBOUND SIGNAL ===
reboundSignal = macdBullishCross and rsiRecovering and volSpike
plotshape(reboundSignal, title="Rebound Signal", location=location.belowbar, color=color.lime, style=shape.labelup, size=size.small, text="REBOUND")
// === Alerts ===
alertcondition(reboundSignal, title="Rebound Alert", message="🔥 Sinyal REBOUND BTC Terdeteksi!")

COT INDEX
// Users & Producers: Commercial Positions
// Large Specs (Hedge Fonds): Non-commercial Positions
// Retail: Non-reportable Positions
//@version=5
int weeks = input.int(26, "Number of weeks", minval=1)
int upperExtreme = input.int(80, "Upper Threshold in %", minval=50)
int lowerExtreme = input.int(20, "Lower Threshold in %", minval=1)
bool hideCurrentWeek = input(true, "Hide the current week until market close")
bool markExtremes = input(false, "Mark long and short extremes")
bool showSmallSpecs = input(true, "Show small speculators index")
bool showProducers = input(true, "Show producers index")
bool showLargeSpecs = input(true, "Show large speculators index")
indicator("COT INDEX", shorttitle="COT INDEX", format=format.percent, precision=0)
import TradingView/LibraryCOT/2 as cot
// Function to fix some symbols.
var string Root_Symbol = syminfo.root
var string CFTC_Code_fixed = cot.convertRootToCOTCode("Auto")
if Root_Symbol == "HG"
CFTC_Code_fixed := "085692"
else if Root_Symbol == "LBR"
CFTC_Code_fixed := "058644"
// Function to request COT data for Futures only.
dataRequest(metricName, isLong) =>
tickerId = cot.COTTickerid('Legacy', CFTC_Code_fixed, false, metricName, isLong ? "Long" : "Short", "All")
value = request.security(tickerId, "1D", close, ignore_invalid_symbol = true)
if barstate.islastconfirmedhistory and na(value)
runtime.error("Could not find relevant COT data based on the current symbol.")
value
// Function to calculate net long positions.
netLongCommercialPositions() =>
commercialLong = dataRequest("Commercial Positions", true)
commercialShort = dataRequest("Commercial Positions", false)
commercialLong - commercialShort
netLongLargePositions() =>
largeSpecsLong = dataRequest("Noncommercial Positions", true)
largeSpecsShort = dataRequest("Noncommercial Positions", false)
largeSpecsLong - largeSpecsShort
netLongSmallPositions() =>
smallSpecsLong = dataRequest("Nonreportable Positions", true)
smallSpecsShort = dataRequest("Nonreportable Positions", false)
smallSpecsLong - smallSpecsShort
calcIndex(netPos) =>
minNetPos = ta.lowest(netPos, weeks)
maxNetPos = ta.highest(netPos, weeks)
if maxNetPos != minNetPos
100 * (netPos - minNetPos) / (maxNetPos - minNetPos)
else
na
// Calculate the Commercials Position Index.
commercialsIndex = calcIndex(netLongCommercialPositions())
largeSpecsIndex = calcIndex(netLongLargePositions())
smallSpecsIndex = calcIndex(netLongSmallPositions())
// Conditional logic based on user input
plotValueCommercials = hideCurrentWeek ? (timenow >= time_close ? commercialsIndex : na) : (showProducers ? commercialsIndex : na)
plotValueLarge = hideCurrentWeek ? (timenow >= time_close ? largeSpecsIndex : na) : (showLargeSpecs ? largeSpecsIndex : na)
plotValueSmall = hideCurrentWeek ? (timenow >= time_close ? smallSpecsIndex : na) : (showSmallSpecs ? smallSpecsIndex : na)
// Plot the index and horizontal lines
plot(plotValueCommercials, "Commercials", color=color.blue, style=plot.style_line, linewidth=2)
plot(plotValueLarge, "Large Speculators", color=color.red, style=plot.style_line, linewidth=1)
plot(plotValueSmall, "Small Speculators", color=color.green, style=plot.style_line, linewidth=1)
hline(upperExtreme, "Upper Threshold", color=color.green, linestyle=hline.style_solid, linewidth=1)
hline(lowerExtreme, "Lower Threshold", color=color.red, linestyle=hline.style_solid, linewidth=1)
/// Marking extremes with background color
bgcolor(markExtremes and (commercialsIndex >= upperExtreme or largeSpecsIndex >= upperExtreme or smallSpecsIndex >= upperExtreme) ? color.new(color.gray, 90) : na, title="Upper Threshold")
bgcolor(markExtremes and (commercialsIndex <= lowerExtreme or largeSpecsIndex <= lowerExtreme or smallSpecsIndex <= lowerExtreme) ? color.new(color.gray, 90) : na, title="Lower Threshold")

Simple EMA Crossover Strategy with Risk ManagementThis is a simple but powerful EMA Crossover strategy designed for intraday and swing traders. The strategy uses two Exponential Moving Averages (EMAs) to generate precise trend-based entries, while applying take profit and stop loss logic to manage risk.
🔍 Strategy Logic:
Buy Entry (Long):
A long position is triggered when the Fast EMA (9) crosses above the Slow EMA (21) — indicating a bullish trend continuation.
Sell Entry (Short):
A short position is opened when the Fast EMA (9) crosses below the Slow EMA (21) — signaling a bearish market reversal.
Risk Management:
Each trade includes a Take Profit and Stop Loss level defined as a percentage of entry price:
✅ Take Profit: Default 1.5%
❌ Stop Loss: Default 1.0%
⚙️ Input Parameters (Fully Customizable):
Fast EMA: Default 9
Slow EMA: Default 21
Take Profit: Default 1.5%
Stop Loss: Default 1.0%
These inputs can be fine-tuned based on your trading asset or timeframe preferences.
💹 Indicator Plots:
Orange Line → Fast EMA (e.g., 9)
Blue Line → Slow EMA (e.g., 21)
These are overlaid on the chart for easy visual confirmation of trend changes and crossover points.
📈 Ideal Market Condition:
This strategy works best in trending markets, especially during momentum shifts.
Avoid ranging/sideways markets where EMAs frequently crisscross.
🧪 Backtesting:
You can run this script in Strategy Tester on any instrument (e.g., XAUUSD, BTCUSD, US30, etc.) and any timeframe. Adjust the inputs to suit your asset.
⚠️ Disclaimer:
This strategy is for educational purposes only. Backtest thoroughly and understand your market before using with real funds. Past performance does not guarantee future results.

BTC Scalping Signals//@version=5
indicator("BTC Scalping Signals", overlay=true)
// === Indikator Utama ===
= ta.macd(close, 12, 26, 9)
ema50 = ta.ema(close, 50)
ema200 = ta.ema(close, 200)
vol = volume
avgVol = ta.sma(vol, 20)
// === Filter Trend & Volume ===
bullTrend = ema50 > ema200
bearTrend = ema50 < ema200
volOK = vol > avgVol
// === Sinyal Scalping ===
buySignal = ta.crossover(macdLine, signalLine) and bullTrend and volOK
sellSignal = ta.crossunder(macdLine, signalLine) and bearTrend and volOK
// === Tampilkan Tanda di Chart ===
plotshape(buySignal, title="BUY", location=location.belowbar, style=shape.labelup, text="BUY", color=color.green, textcolor=color.white, size=size.small)
plotshape(sellSignal, title="SELL", location=location.abovebar, style=shape.labeldown, text="SELL", color=color.red, textcolor=color.white, size=size.small)
// === Tambahan Visual ===
plot(ema50, title="EMA 50", color=color.teal)
plot(ema200, title="EMA 200", color=color.orange)
// === Alert untuk Webhook / Telegram ===
alertcondition(buySignal, title="Scalp BUY Alert", message="SCALPING BTC - BUY at {{close}}")
alertcondition(sellSignal, title="Scalp SELL Alert", message="SCALPING BTC - SELL at {{close}}")


Ichimoku Cloud Buy & Custom EMA Exit [With Volume and Filters]1BUY STRATEGY USING ICHIMOKU CLOUD, Ichimoku Cloud Buy with good risk reward ratio

Scalping Alert BTC by Mas Posman//@version=5
indicator("Scalping Alert BTC by Mas Posman", overlay=true)
// === Input ===
fast = input.int(12, title="MACD Fast")
slow = input.int(26, title="MACD Slow")
signal = input.int(9, title="MACD Signal")
rsiLen = input.int(14, title="RSI Length")
// === MACD ===
= ta.macd(close, fast, slow, signal)
macdCrossUp = ta.crossover(macdLine, signalLine)
macdCrossDown = ta.crossunder(macdLine, signalLine)
// === RSI ===
rsi = ta.rsi(close, rsiLen)
rsiBuyZone = rsi < 40
rsiSellZone = rsi > 70
// === Volume Spike ===
volAvg = ta.sma(volume, 20)
volSpike = volume > volAvg * 1.5
// === Signals ===
buySignal = macdCrossUp and rsiBuyZone and volSpike
sellSignal = macdCrossDown and rsiSellZone and volSpike
plotshape(buySignal, location=location.belowbar, color=color.lime, style=shape.labelup, text="BUY")
plotshape(sellSignal, location=location.abovebar, color=color.red, style=shape.labeldown, text="SELL")
// === Alerts ===
alertcondition(buySignal, title="BUY Alert", message="🟢 Scalping BUY Signal BTC!")
alertcondition(sellSignal, title="SELL Alert", message="🔴 Scalping SELL Signal BTC!")

BTC Scalping Signals//@version=5
indicator("BTC Scalping Signals", overlay=true)
// === Indikator Utama ===
= ta.macd(close, 12, 26, 9)
ema50 = ta.ema(close, 50)
ema200 = ta.ema(close, 200)
vol = volume
avgVol = ta.sma(vol, 20)
// === Filter Trend & Volume ===
bullTrend = ema50 > ema200
bearTrend = ema50 < ema200
volOK = vol > avgVol
// === Sinyal Scalping ===
buySignal = ta.crossover(macdLine, signalLine) and bullTrend and volOK
sellSignal = ta.crossunder(macdLine, signalLine) and bearTrend and volOK
// === Tampilkan Tanda di Chart ===
plotshape(buySignal, title="BUY", location=location.belowbar, style=shape.labelup, text="BUY", color=color.green, textcolor=color.white, size=size.small)
plotshape(sellSignal, title="SELL", location=location.abovebar, style=shape.labeldown, text="SELL", color=color.red, textcolor=color.white, size=size.small)
// === Tambahan Visual ===
plot(ema50, title="EMA 50", color=color.teal)
plot(ema200, title="EMA 200", color=color.orange)
// === Alert untuk Webhook / Telegram ===
alertcondition(buySignal, title="Scalp BUY Alert", message="SCALPING BTC - BUY at {{close}}")
alertcondition(sellSignal, title="Scalp SELL Alert", message="SCALPING BTC - SELL at {{close}}")

Mr. Posman Signal Scalping v2.0//@version=6
indicator('Mr. Posman Signal Scalping v2.0', overlay = true)
// === Input Parameter
macd_fast = input.int(12, title = 'MACD Fast')
macd_slow = input.int(26, title = 'MACD Slow')
macd_signal = input.int(9, title = 'MACD Signal')
rsi_length = input.int(14, title = 'RSI Length')
ema_fast_len = input.int(50, title = 'EMA 50')
ema_slow_len = input.int(200, title = 'EMA 200')
rsi_buy_level = input.int(40, title = 'RSI Buy Level')
rsi_sell_level = input.int(60, title = 'RSI Sell Level')
// === Indicator Calculation
= ta.macd(close, macd_fast, macd_slow, macd_signal)
rsi = ta.rsi(close, rsi_length)
ema_fast = ta.ema(close, ema_fast_len)
ema_slow = ta.ema(close, ema_slow_len)
// === Trend Filter
trend_up = ema_fast > ema_slow
trend_down = ema_fast < ema_slow
// === Sinyal Beli
buy_condition = ta.crossover(macdLine, signalLine) and rsi < rsi_buy_level and close > ema_fast and trend_up
// === Sinyal Jual
sell_condition = ta.crossunder(macdLine, signalLine) and rsi > rsi_sell_level and close < ema_fast and trend_down
// === Plot Sinyal
plotshape(buy_condition, title = 'BUY Signal', location = location.belowbar, color = color.lime, style = shape.labelup, text = 'BUY', textcolor = color.black)
plotshape(sell_condition, title = 'SELL Signal', location = location.abovebar, color = color.red, style = shape.labeldown, text = 'SELL', textcolor = color.white)
// === EMA Lines
plot(ema_fast, title = 'EMA 50', color = color.orange)
plot(ema_slow, title = 'EMA 200', color = color.teal)
// === Alerts
alertcondition(buy_condition, title = 'Buy Alert', message = 'Mr. Posman BUY Signal - BTC Scalping')
alertcondition(sell_condition, title = 'Sell Alert', message = 'Mr. Posman SELL Signal - BTC Scalping')

Relative Strength vs Nifty//@version=5
indicator("Relative Strength vs Nifty", overlay=false)
symbol = "NSE:NIFTY"
nifty_close = request.security(symbol, timeframe.period, close)
rs = close / nifty_close
plot(rs, title="Relative Strength", color=color.blue)

ICT Concepts [LuxAlgo//@version=5
indicator("Full Entry: RSI + EMA + CHoCH + FVG + TP/SL", overlay=true)
rsiPeriod = 14
emaPeriod = 50
tpPerc = 1.5
slPerc = 1.0
is15min = timeframe.period == "15" // يشتغل فقط على فريم 15 دقيقة
rsi = ta.rsi(close, rsiPeriod)
ema = ta.ema(close, emaPeriod)
// قمة وقاع سابقة
ph = ta.highest(high, 20)
pl = ta.lowest(low, 20)
// CHoCH
bullCHoCH = close > ph and close > ema
bearCHoCH = close < pl and close < ema
// FVG حساب
fvgUp = low > high
fvgDn = high < low
fvgHigh = high
fvgLow = low
touchFVGUp = fvgUp and low <= fvgHigh and low >= fvgLow
touchFVGDown = fvgDn and high >= fvgLow and high <= fvgHigh
// دخول فقط بفريم 15 دقيقة + لمس FVG
longEntry = is15min and bullCHoCH and rsi < 35 and touchFVGUp
shortEntry = is15min and bearCHoCH and rsi > 65 and touchFVGDown
// TP/SL
longTP = close * (1 + tpPerc / 100)
longSL = close * (1 - slPerc / 100)
shortTP = close * (1 - tpPerc / 100)
shortSL = close * (1 + slPerc / 100)
// إشارات دخول
plotshape(longEntry, location=location.belowbar, color=color.green, style=shape.labelup, text="BUY")
plotshape(shortEntry, location=location.abovebar, color=color.red, style=shape.labeldown, text="SELL")
// TP / SL
plot(longEntry ? longTP : na, style=plot.style_cross, color=color.green)
plot(longEntry ? longSL : na, style=plot.style_cross, color=color.red)
plot(shortEntry ? shortTP : na, style=plot.style_cross, color=color.red)
plot(shortEntry ? shortSL : na, style=plot.style_cross, color=color.green)
// EMA
plot(ema, title="EMA 50", color=color.orange)
// FVG رسم
boxFVG = fvgUp or fvgDn
var box fvgBox = na
if boxFVG
fvgBox := box.new(left=bar_index, top=fvgHigh, right=bar_index + 3, bottom=fvgLow, border_color=color.gray, bgcolor=color.new(color.gray, 85))
// تنبيهات
alertcondition(longEntry, title="Buy Signal", message="Buy: CHoCH + RSI + EMA + FVG")
alertcondition(shortEntry, title="Sell Signal", message="Sell: CHoCH + RSI + EMA + FVG")

XAUUSD Smart Money Sweep StrategyThis is a custom-built Smart Money Concept (SMC) strategy for XAUUSD that detects liquidity sweeps at key swing levels and confirms entries using momentum-based reversal candles. It simulates institutional behavior by entering trades only when price grabs liquidity (stop hunts above highs or below lows), then shows strong rejection in the opposite direction.
The strategy uses precise entry logic, fixed stop loss, and a customizable risk-to-reward ratio for dynamic take-profit targeting. All trades are fully backtestable using TradingView’s built-in strategy() functions.
This approach is ideal for Smart Money traders looking to exploit price inefficiencies without relying on BOS or FVG logic.
🔑 Key Features:
Liquidity Sweep Logic: Detects price sweeping above recent highs or below recent lows, simulating stop hunts and liquidity grabs.
Candle Confirmation Filter: Confirms entry only if a strong reversal candle (momentum shift) forms after the sweep, avoiding weak entries.
Full Backtest Engine: Uses TradingView's strategy.entry() and strategy.exit() to simulate trades with real SL/TP tracking.
Custom Risk Management: Adjustable stop loss (in pips) and risk-to-reward (RR) ratio allow you to shape trade outcomes and optimize strategy performance.
Non-Repainting Logic: All entries are based on closed candles, meaning the signals never repaint and are reliable for testing and execution.
⚙️ Settings:
Setting Description
Liquidity Lookback Number of candles to look back for swing highs/lows to determine sweeps
Stop Loss (pips) Distance below/above entry where SL is placed (fixed pip SL)
Risk/Reward Ratio Multiplies SL to calculate TP (e.g., 1:2 = 2x SL as TP)
Entry Logic Requires sweep + a momentum candle (e.g., bullish close after a sweep down)
📊 How It Works:
The strategy scans recent price action using a lookback range to find the highest high and lowest low (liquidity zones).
If price sweeps above the high or below the low, this triggers a potential entry condition.
A momentum candle confirmation must follow immediately:
For long trades: bullish candle (close > open, and close > previous close)
For short trades: bearish candle (close < open, and close < previous close)
If confirmed, the strategy:
Enters the trade
Places a fixed stop loss in pips
Sets a dynamic TP using the RR ratio
All trades are logged and visualized in the Strategy Tester panel for performance review.
📌 Optimized For:
XAUUSD (Gold) on 15m, 30m, and 1H timeframes
Smart Money / ICT / Liquidity-based trading styles
Traders who prefer reversal setups after liquidity raids
Systems focused on precise execution and high-RR setups
📎 Release Notes:
v1.0 – First release featuring liquidity sweep detection, candle confirmation logic, SL/TP execution, and Strategy Tester support. Clean structure designed for real-world backtesting on volatile instruments like gold.
⚠️ Disclaimer:
This script is for educational and research purposes only. It does not constitute financial advice or signal services. Always validate strategy results with manual backtesting and apply proper risk management.

SMC Liquidity Sweep + OB [Fixed]This is a Smart Money Concept (SMC) backtest-ready strategy built to identify high-probability reversal points using two key institutional principles: liquidity sweep and order block confirmation. Designed specifically for pairs like XAUUSD, this system detects where the market sweeps resting liquidity (e.g., stop hunts above recent highs or below recent lows) and looks for a clean reversal candle (order block) to confirm the trap and trigger precise entries.
Unlike BOS or FVG-based models, this version focuses purely on stop-hunt logic and clean price action to simulate institutional behavior—ideal for Smart Money and ICT-style traders who want clear, non-repainting, high-RR setups.
🔍 How the Strategy Works
Liquidity Sweep Detection
The strategy monitors the chart for price breaking above recent swing highs or below recent swing lows (based on a customizable lookback window). This acts as a trigger for a potential trap or liquidity raid.
Order Block Confirmation
After a sweep is detected, the system waits for a confirming candle — a reversal (engulfing-type) candle that acts as an order block:
For longs: a bullish candle that closes higher than the previous bearish candle’s high
For shorts: a bearish candle that closes lower than the previous bullish candle’s low
Entry & Risk Management
Once confirmation is valid, a market entry is placed:
Stop Loss (SL): A fixed pip distance below/above the entry candle
Take Profit (TP): Calculated based on a user-defined Risk-Reward Ratio (e.g., 1:2, 1:3)
Trades are managed automatically and logged into the Strategy Tester with full visibility
🔧 Strategy Parameters
Setting Description
Stop Loss (Pips) Fixed SL distance from entry to protect capital
Risk/Reward Ratio Dynamically calculates TP relative to SL (e.g., RR 2.0 = TP 2x SL)
Liquidity Lookback How many candles back to evaluate swing highs/lows for potential sweeps
Order Block Filter Validates entry only after candle confirmation post-sweep
Direction Filter Supports both long and short signals or one-sided entry filters
📈 Use Case & Optimization
This strategy works best when applied to:
XAUUSD, NAS100, BTCUSD, US30, and high-volatility pairs
Timeframes like 5m, 15m, 1H, where sweeps and reversals are more visible
Traders who follow ICT, SMC, or price action frameworks
Reversal or continuation traders looking for clean execution after liquidity grabs
Because it uses pure price action and logical candle structures, it avoids lag and repainting found in indicator-based systems.
💡 Smart Money Concept Logic Used
Liquidity Grab: Detects stop hunts above recent highs/below lows
Order Block Entry: Entry confirmed only after strong reversal candle at sweep zone
High RR Control: SL and TP customizable to reflect real trading plans
Non-Repainting Structure: All entries are based on confirmed candle closes
📊 Built-in Backtesting Features
Plots trades visually with entry arrows and signal labels
Uses strategy.entry() and strategy.exit() for full testing accuracy
Outputs full performance metrics: win rate, profit factor, drawdown, etc.
All parameters tunable from the settings panel
📎 Release Notes
v1.0
Core SMC strategy with liquidity sweep + OB entry logic
Fully backtestable with fixed SL & dynamic TP
Plots buy/sell signals visually
Optimized for metals, indices, and crypto
⚠️ Disclaimer
This TradingView script is intended for educational and research purposes only. It is not financial advice or a live signal system. Always backtest on your own charts, confirm entries with your personal analysis, and apply strict risk management.
