MACD + Stochastic + RSI StrategyMy strategy uses a combination of three indicators MACD Stochastic RSI.
The Idea is to buy when (MACD > Signal and RSI > 50 and Stochastic > 50) occures at the same time
This strategy works well on stocks and cryptos especially during market breaking up after consolidation
The best results are on Daily charts, so its NOT a scalping strategy. But it can work also on 1H charts.
The strategy does not have any stops and profit targets, so we can take all the market can give us at the moment.
The exit point only when MACD goes under Signal
Its Preformance is quite stable.
So, use it, trade it.
If it will help you to imprive your trading results, please donate me
BTC: 12kd1F8buWisUBdq27BBwRkUvzW7Ey3og5
Bitcoin (Cryptocurrency)

Combination Ichimoku CloudThis indicator allows you to display two Ichimoku Cloud settings simultaneously. Each variable can be set independently, including its visibility.
Basically a way to combine two "Ichimoku Cloud" indicators into one slot.

CS Basic Scripts - Stochastic Special (Strategy)This Stochastic Special Strategy features inputs for:
- Custom Backtesting Date Range
- Long and Short Strategy Discinctions
- Utilize SMI, RSI, Martingale, and Body-Filter Strategy
- Adjust the SMI Percent Lengths and Limit
- Automate with the Autoview Trading Bot
Strategy script may be tested by favoriting and adding to any chart.
Study script is available for automated trading at www.cryptoscores.org

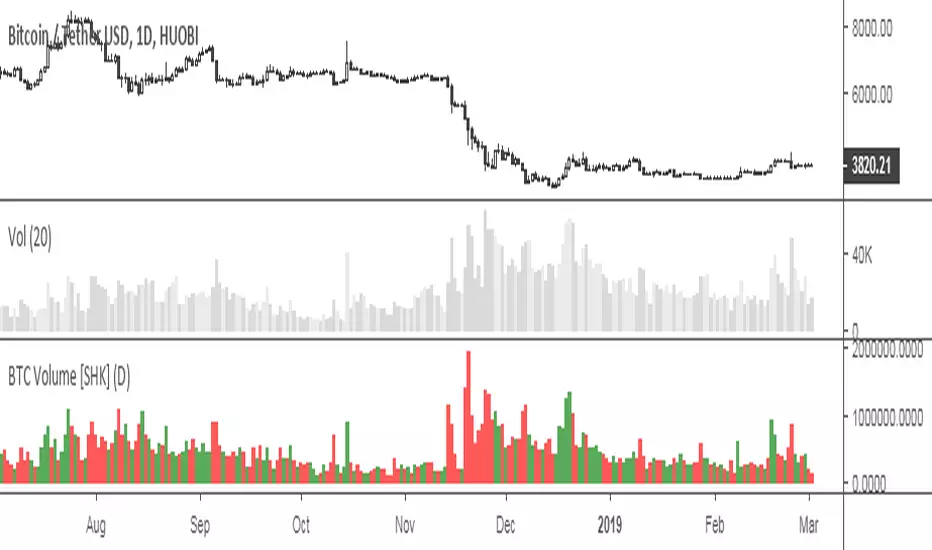
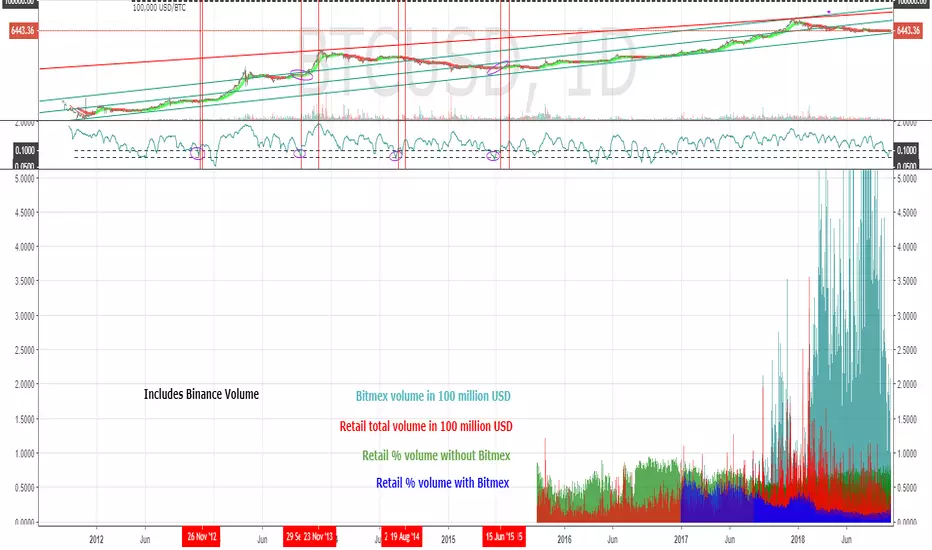
BTC Exchanges Volume [SHK]Useful script to calculate sum of BTC ( Bitcoin ) volumes on different exchanges.
Supported Exchanges:
Coinbase
Bitfinex
Bitmex
Houbi
CEX
Bitstamp
Binance
BitFlyer
Poloniex
Bittrex
Flyer
OkEx
Poloniex
Gemini
HitBTC
Fundstrat IndexesDisplays two of Fundstrat's Indexes as taken from TradingView.
Options to configure include displaying the first, second or both chosen indexes as well as a ratio of the two.
When comparing indexes, they're a bit "off", as data is not backfilled in consideration for initial index weighting. Feature not a bug?

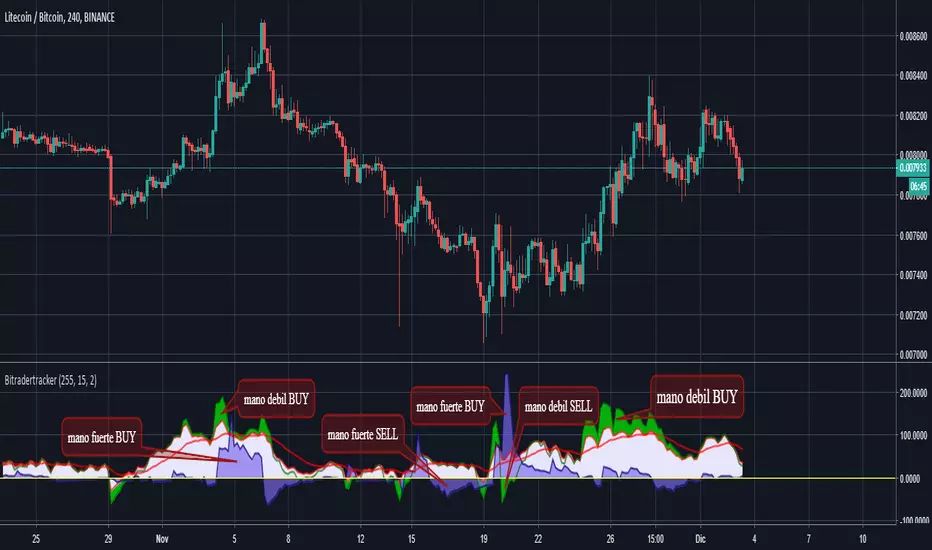
BitradertrackerEste Indicador ya no consiste en líneas móviles que se cruzan para dar señales de entrada o salida, si no que va más allá e interpreta gráficamente lo que está sucediendo con el valor.
Es un algoritmo potente, que incluye 4 indicadores de tendencia y 2 indicadores de volumen.
Con este indicador podemos movernos con las "manos fuertes" del mercado, rastrear sus intenciones y tomar decisiones de compra y venta.
Diseñado para operar en criptomonedas.
En cuanto a qué temporalidad usar, cuanto más grande mejor, ya que al final lo que estamos haciendo es el análisis de datos y, por lo tanto, cuanto más datos, mejor. Personalmente recomiendo usarlo en velas de 30 minutos, 1 hora y 4 horas.
Recuerde, ningún indicador es 100% efectivo.
Este indicador nos muestra en las áreas de color púrpura (manos fuertes) y en las áreas de color verde (manos débiles) y al mostrármelo gráficamente ya el indicador vale la pena.
El mercado está impulsado por dos tipos de inversores, que se denominan manos fuertes o ballenas (agencias, fondos, empresas, bancos, etc.) y manos débiles o peces pequeños (es decir, nosotros).
No tenemos la capacidad de manipular un valor, ya que nuestra cartera es limitada, pero podemos ingresar y salir de los valores fácilmente ya que no tenemos mucho dinero.
Las ballenas pueden manipular un valor ya que tienen muchos bitcoins y / o dinero, sin embargo, no pueden moverse fácilmente.
Entonces, ¿como pueden comprar o vender sus monedas las ballenas? Bueno, ellos hacen su juego: Tratan de hacernos creer que la moneda esta barata cuando nos quieren vender sus monedas o hacernos creer que la moneda es cara cuando quieren comprar nuestras monedas. Esta manipulación se realiza de muchas maneras, la mayoría por noticias.
Nosotros, los pequeños peces, no podemos competir contra las ballenas, pero podemos descubrir qué están haciendo (recuerde, son lentas, mueven sus monstruosas cantidades de dinero) debemos movernos con ellas e imitarlas. Mejor estar bajo la ballena que delante de ella.
Con este indicador puedes ver cuando las ballenas están operando y reaccionar ; porque el enfoque matemático que los sustenta ha demostrado ser bastante exitoso.
Cuando las manos fuertes están por debajo de cero, se dice que están comprando. Lo mismo ocurre con las manos débiles. Generalmente, si las manos fuertes están comprando o vendiendo, el precio está lateralizado. El movimiento del precio está asociado con las compras y ventas realizadas por la mano débil.
Espero que les sea de mucha utilidad.
Bitrader4.0
This indicator no longer consists of mobile lines that intersect to give input or output signals, but it goes further and graphically interprets what is happening with the value.
It is a powerful algorithm, which includes 4 trend indicators and 2 volume indicators.
With this indicator we can move with the "strong hands" of the market, track their intentions and make buying and selling decisions.
Designed to operate in cryptocurrencies.
As for what temporality to use, the bigger the better, since in the end what we are doing is the analysis of data and, therefore, the more data, the better. Personally I recommend using it in candles of 30 minutes, 1 hour and 4 hours.
Remember, no indicator is 100% effective.
This indicator shows us in the areas of color purple (strong hands) and in the areas of color green (weak hands) and by showing it graphically and the indicator is worth it.
The market is driven by two types of investors, which are called strong hands or whales (agencies, funds, companies, banks, etc.) and weak hands or small fish (that is, us).
We do not have the ability to manipulate a value, since our portfolio is limited, but we can enter and exit the securities easily since we do not have much money.
Whales can manipulate a value since they have many bitcoins and / or money, however, they can not move easily.
So, how can whales buy or sell their coins? Well, they make their game: They try to make us believe that the currency is cheap when they want to sell their coins or make us believe that the currency is expensive when they want to buy our coins. This manipulation is done in many ways, most by news.
We, small fish, can not compete against whales, but we can find out what they are doing (remember, they are slow, move their monstrous amounts of money) we must move with them and imitate them. Better to be under the whale than in front of her.
With this indicator you can see when the whales are operating and reacting; because the mathematical approach that sustains them has proven to be quite successful.
When strong hands are below zero, they say they are buying. The same goes for weak hands. Generally, if strong hands are buying or selling, the price is lateralized. The movement of the price is associated with the purchases and sales made by the weak hand.
I hope you find it very useful.
Bitrader4.0
RSI BackgoundPlots a Green/Red strip on the price chart to highlight when RSI goes overbought or oversold.
You can optimize it by yourself on the source code, just change "70" or "30" for your desired value.
Cheers!

Bitmex Bitcoin BasisInspired by the Ugly Old Goat's articles about the Bitcoin basis - medium.com
with the help of @Plumptoiletduck this indicator was created to show the Bitmex futures premium or discount.
Note you need to add in the new futures ticker every 3 months.

Crypto Correlation Matrix Series [SHK]Hi everyone, Although everything's clear from the title but I should describe some basic points.
Currency Correlation is a statistical measure of how two securities move in relation to each other.
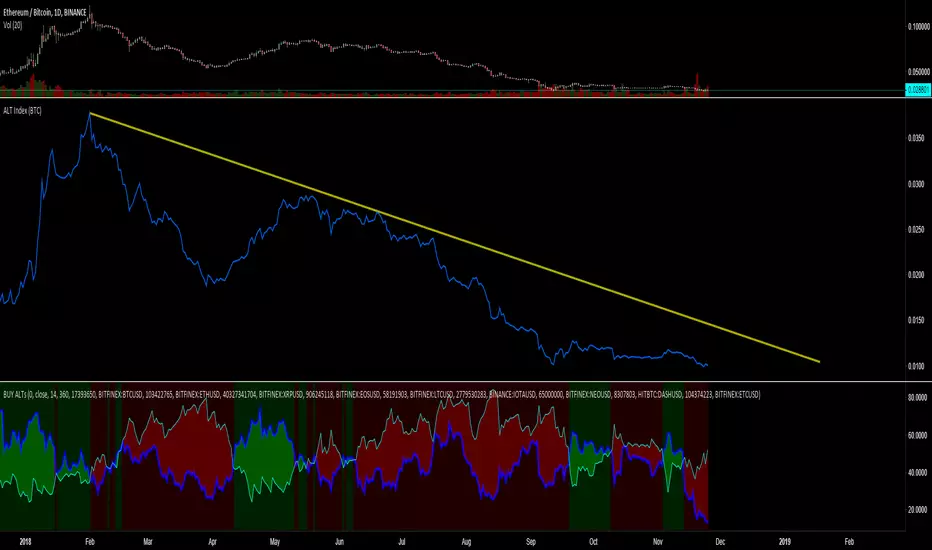
So this script is used to show if current pair (alt-coins) is moving in the same direction of bitcoin (or ethereum) or not. Consider that in crypto market most of alt-coins have correlation of +0.7 with bitcoin, So temporary changes in correlation may signal a reversal or sharp continuation for the alt-coin.
"1" : The alt coin is moving in same direction of Bitcoin (Or Ethereum).
"0" : The alt coin is moving in random direction compared to Bitcoin. (No movement relation)
"-1" : The alt coin is moving in opposite direction of Bitcoin.
Important Note: By default average of 15 bars back is measured to calculate the correlation by this script. Please test other periods and share the best options with us.
Comments are welcomed :)

Is Open equal to High or LowMany people are watching opening price on each time axis. Opening price is very important.
This indicator displays OHLC Open as a line in multiple time frame.
If open is close to high or low, the color of the line changes.
The fact that they are close means the strength of the market flow and the firmness of that price range.
Note:
The color of the line will not be fixed until bar is closed.
And when using, please set arbitrary coefficient according to each market.
Coefficient e.g.
EURUSD: 0.00005
BTCUSD: 1
DJI: 5
BTCJPY: 100
USDJPY: 0.01
NI225: 2

Total Bitcoin Volume [@MetaDonTrader]Aggregates all the bitcoin volume from different exchanges. Note that new exchanges like Binance and Bitmex will have an affect on this data as well. Who's to say how much of it is legit and how much is wash trading.
Bitfinex Longs/Shorts Ratio AlertableThis script contains Bitfinex longs/short ratio and generates alarms with a given input .default value is 60 which means alerts when either shorts/longs reach 60:40 ratio

CryptoManic: Long/Short Interest ChangeA simple script to determine the change in Long and short open interest (Bitfinex symbols). i.e. the change in open interest from the previous candle.
Usage: in settings. Go to inputs and in symbol enter your symbol. e.g.
BTCUSD
ETHUSD
ADABTC
BCHBTC
EOSBTC
XRPBTC
TRXBTC
LTCBTC
It plots overlapping area chart of change in open long contracts (in green) and open short contracts (in red)
U.S. Stocks & Options CVI to Bitcoin Correlation [NeoButane]Conceptual indicator based on trying to find an inverse correlation between bitcoin and traditional markets due to bitcoin's usefulness as a hedge against economic downturns.
How to use this script: you look at it and see if there is a correlation or not between bitcoin/Ethereum price and either U.S. stock CVi, buy volume, sell volume, calls, puts, or the call/put ratio.


Bitcoin Retail Volume [jarederaj]Based on work published by @cryptorae
www.tradingview.com
Merges Binance volume into several metrics.
Bitmex BTC FuturesBitmex / Bitcoin indicator.
Just a simple overlay to visualise the contango / backwardation on Bitmex btc futures products so you know which to take position in, at a glance.
There are two selectable instruments (I have Dec18 and Mar19 selected already). By default the one with nearest settlement date is plotted with a filled coloured band from current price, the other plots a cross symbol.

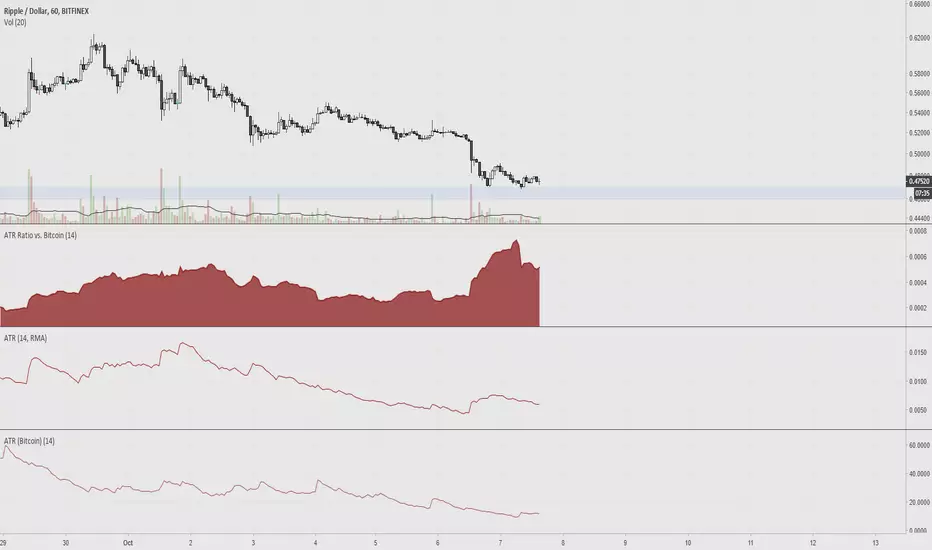
ATR Ratio vs. BitcoinAverage True Range is used to determine if a ticker's trading range is widening or narrowing, which is helpful for finding the trend or to use as a stop loss. The idea of this indicator is to compare the ATR of altcoins versus bitcoin, since volatility is low.
Renko CandlesticksRenko charts are awesome . They reduce noise by only painting a brick on the chart when price moves by a specified amount up/down. When the price reverses, it must go twice the specified amount before a brick is painted. Time is not a factor, just price movement. Sometimes however, you want the pros of a renko chart, but on a regular candlestick chart. This indicator attempts to do just that.
A band is placed around price action showing the upper and lower bounds of what would be the current renko brick. The band only goes up/down when the price action itself moves up/down by the amount you specify. There are several ways of specifying the amount:
Fixed Price Amount: As the name says, you enter the brick size amount, i.e. the amount the price has to move before being in a new brick.
% of Price: This method will calculate the amount the price has to move as a percentage of the price itself. This way as price goes up/down, your brick size will adjust accordingly. Recommended values would be around 1% or less.
% of ATR: This option will make the brick size a percentage of the Average True Range. You can specify the ATR time frame to be different from your current time frame as well as the ATR length. For instance you could be on a 10 minute chart but specify the ATR to be daily with a length of 3 and a percentage amount of 15. This would make your brick size 15% of the Average True Range for the last 3 days. Recommended values are 10 to 20%.
Use this indicator on any time frame, even the 1 minute as the renko bands span the price action the same way on any time frame easily letting you know whether or not the price has moved appreciably, regardless of how much time has passed.
You can also set alerts easily, simply set the alert to crossing and choose “Renko Candlesticks” instead of “Value”. You will then see the options for the renko upper and lower bounds.
Tested on Bitcoin with the following values:
Fixed Price Amount: 30 ($30)
% of Price: 0.45 (if Bitcoin is $7000 then the brick size would be $31.50)
% of ATR: 15%, ATR Time Frame: 1D, ATR Length: 3 (3 days)
