VWAP Bands Team AustraliaThis indicator add 6 configurable vwap bands for each side of the vwap price.
Breadth Indicators

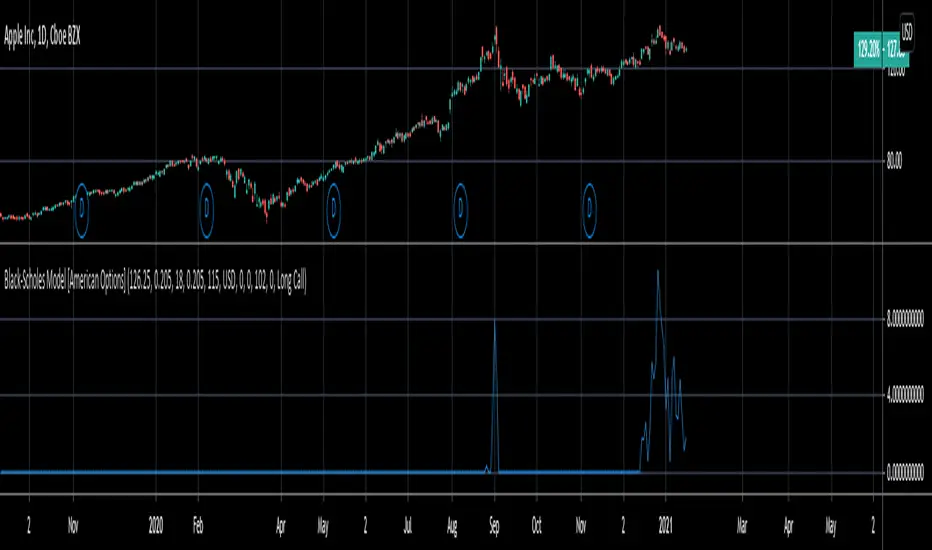
Black-Scholes Model for American OptionsThis model uses Black's Approximation to price American Options. Black's Approximation is an extension of the traditional Black-Scholes model that allows the price of American Options to be approximated within the Black-Scholes Framework. This is necessary because the traditional Black-Scholes model only works on options that are exercised at expiry, not before; like American Options can be.
Black's Approximation approximates the value of an American option by:
1st. Calculating the theoretical price of a european call or put based on the strike price (K), spot price (S), annual return (sigma), time until expiry (T), times until the next 2 ex-dividend dates (t1 & t2), and the dividend paid out at times t1 and t2 (D1 and D2).
2nd. The theoretical price of an option expiring on the second ex-dividend date (t2) is calculated. This replicates exercising the option early.
3rd. Finally, the highest price of the two theoretical prices calculated in steps 1 & 2 is chosen as the approximated price.
How to use this:
1st. Input your strike price.
2nd. Input the risk-free-rate of the currency the option is based in.
3rd. Input the dividend yield for the next ex-dividend date. For example AAPL's dividend yield is 0.82 and will be paid out on August 7,2020.
4th. Input the time until the next ex-dividend date. For example AAPL's next ex-dividend date is August 7,2020, which is 61 days away. So you'd input 61 (this includes weekends and holidays).
5th. Input the dividend yield for the ex-dividend date after the next one. For example AAPL's dividend yield after the next one is 0.82 and will be paid out on November 6, 2020.
6th. Input the time until the next furthest ex-dividend date. For example AAPL's next ex-dividend date after Aug 7th, is on November 6, 2020, which is 152 days away. So you'd input 152 (this includes weekends and holidays).
7th. Input your time until expiry. You can do so in terms of days, hours, and minutes.
8th. Input your chart time-frame in term of minutes. For example, if you're using the 1 min time-frame enter 1, 4hr time-frame enter 480, daily time-frame enter 1440.
9th. Lastly, pick what type of option you want data for: Long Call or Long Put.
*Disclaimer, because Black's Approximation is mostly geared towards stocks, this will only work for stocks. Also, the time variables: time until expiry and time until the ex-dividend dates; don't automatically update. So you will have to update them each day.
Position/stops calculation for controlled trade.Calculate your position and stop loss directly within the trading view chart.
parameters:
Wallet Balance ==> represent you trading account wallet balance
Stop loss purcentage from entry ==> represent the pourcentage of the stop loss from the entry
risk purcentage per trade ==> represent the percentage of you wallet balance you are willing to loose after taking position in a trade, it is advisable to use a maximum risk of 3% or even much less.

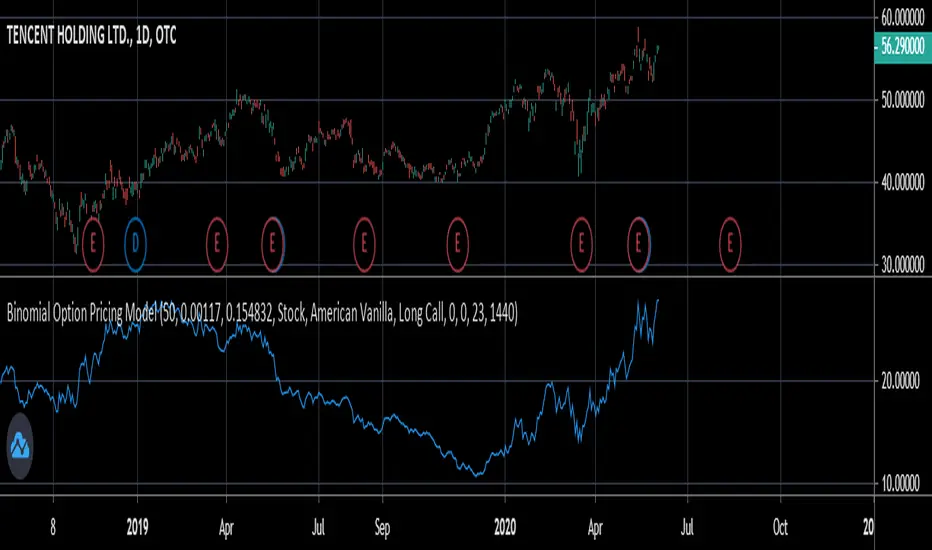
Binomial Option Pricing ModelA binomial option pricing model is an option pricing model that calculates an option's price using binomial trees. The BOPM method of calculating option prices is different from the Black-Scholes Model because it provides more flexibility in the type of options you want to price. The BOPM, unlike the BS model typically used for European style options, allows you to price options which have the ability to exercise early, such as American or Bermudan options. Although you can use the BOPM for any option style.
This specific model allows you to price both American and European vanilla options.
The way the BOPM calculates option prices is by:
First, dividing up the time until expiry into equal parts called steps. This specific model presented only uses 2 steps. For example, say you have an option with an expiry of 60 days, and your binomial tree has only two steps. Then each step will contain 30 days.
Second, the model will project the expected price of the underlying at the end of each step, called a node. The expected price is calculated by using the underlying's volatility and projecting what the price of the underlying would be if it were to rise and fall. This step is repeated until the terminal node, aka the end of the tree, is reached.
Third, once the terminal node's expected underlying prices are calculated, their expected option prices must be calculated.
Finally, after calculating the terminal option prices, backwards induction must be used to calculate the option prices at the previous nodes, until you reach Node 0, aka the current option price.
In order to use this model:
1st. Enter your option's strike price.
2nd. Enter the risk-free-rate of the currency the option is based in.
3rd. Enter the dividend yield of the underlying if it's a stock, or the foreign risk-free-rate if it's an FX option.
*For example, if you were trading an AAPL stock option, in the risk-free-rate box mentioned in step 2, you would enter the US risk-free-rate because AAPL options are traded in US dollars. In the dividend yield box mentioned in step 3, you would enter the stock's dividend yield, which for AAPL is 0.82.
*If you were, for example, trading an option on the EUR/JPY currency pair, the risk-free-rate mentioned in step 2, would be the Japanese risk-free-rate. Then in the the dividend yield box from step 3, you'd input the Eurozone risk-free-rate.
*If you were trading an options on futures contract, the risk-free-rate mentioned in step 2, would be the risk-free-rate for whatever currency the futures contract is denominated in. For example EUR futures are denominated in USD, so you would input the US risk-free-rate. Meanwhile, something like FTSE futures are denominated in GBP, so you would input the British risk-free-rate. As for the dividend yield box mentioned in step 3, for all options on futures, enter 0.
4th. Pick what type of underlying the option is based on: stock, FX, or futures.
5th. Pick the style of option: American or European.
6th. Pick the type of option: Long Call or Long Put.
7th. Input your time until expiry. You can express this in terms of days, hours, and minutes.
8th. Lastly, input your chart time-frame in term of minutes. For example, if you're using the 1 min time-frame enter 1, 4hr time-frame enter 480, daily time-frame enter 1440.
*Disclaimer, because this particular model only uses 2 steps, it won't work on stocks with high prices (over $100). If you want to use this on stocks with prices greater than $100, you would need to add more steps to the code, shown below. The model in its current form should work for stocks below $100.
CoGrid ManagementThis strategy uses grid levels determined by pivot points based on the selected time period.
It's useful for swing trading without leverage, spot trading or for Hold management.
If the price goes down we buy and if it continues to go down we keep buying improving the average price.
When the price rises above the average entry price, we sell and if it continues to rise, we continue to sell.
It works for any pair as long as Buys and Sells quantities are adjusted correctly.
In these times of great economic change, good luck to everyone 🍀

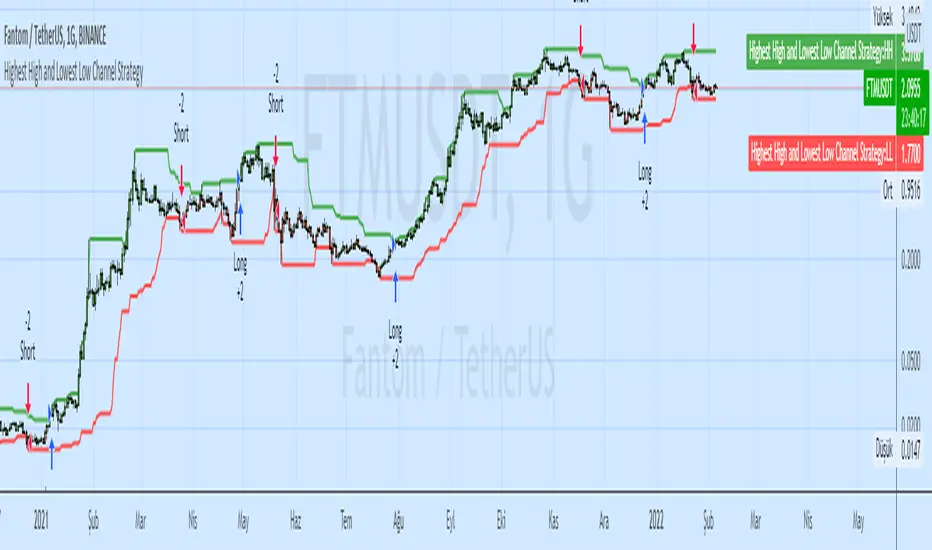
Highest High and Lowest Low Channel StrategyHighest / Highest High Highest (Data) - HHV (Data, Period)
Lowest / Lowest Low Lowest (Data) LLV (Data, Period)
These functions calculate the highest / lowest value of a selected data.
Highest High and Lowest Low options are mostly used.
The Highest function calculates the highest value of the selected data in the past.
The Lowest function calculates the lowest value of the selected data in the past.
ADD for SPX intraday (NYSE Adv-Decl) -Tom1traderThis is the NYSE Advancers - decliners which the SPX pretty much follows. You can chart it like any index (ADD -NYSE $ADV MINUS $DECL) but I find it more useful in a separate panel with colors for direction.
The level gives an idea of days move (example: plus or minus 500 is not much movement through the session) but I follow the direction as when more stocks advance (green) or decline (red) the index tends to track it pretty closely.
On SPX, SPY and correlateds - very useful for intra-day trading (Scalping or 0DTE option trades) but not for higher time frames at all. If you chart the ADD in a chart and compare 5 minute to daily you will see what I mean.
I left it at 5 minutes timeframe which displays well on any intraday chart. You can change it by changing the "5" in the security function on line 13 to what you want ("1" 1 minute, "15" 15 minutes) or change it to timeframe.period (no quotes) so that it will follow the timeframe of the current chart. I like 5 min as it displays better on higher timeframes i.e. 15 min. or hour.
A simple moving average with a length of 10 is added to help gauge momemtum.
Hope this helps with trading or scripting ideas, questions or feed back welcome. Keep Smiling.

Prevous High & Low by Period + NY Zone
This is based on various example code and research done to try and help using the free ICT OTE Pattern on the NY 08:30 to 11:00 am
I tried to make this work on multiple time frames and settings but its best below 8hr
Legend (some of these are for fun and working examples)
RED BG color = Sunday Trading
MAROON STAR = Experiment in significant movement over the last 3 bars
Blue X = Engulfing Candle Marker
I have used this script as a building basis and research contributed by various sources on the internet. Its for learning purposes and helping to draw some lines.

McClellan Oscillator [CC]The McClellan Oscillator was created by Sherman and Marian McClellan and it is essentially a MACD of the advancing and declining symbols of the day and is best used as a comparison with the biggest stocks such as my example Apple but that is just my opinion. I pulled the symbol names from a Trading View blog so I'm not 100% sure if they are accurate so please let me know if I'm wrong. Buy when the indicator is over 0 and sell when it falls below 0 but keep in mind that these values are for the market itself and not the individual symbol.
This was a special request so let me know if you would like me to publish more scripts or if you want something custom done!
Note: I'm republishing this because the original script couldn't be found in searches so this will fix that.

McGinley Dynamic Indicator This is a strategy based on the Mcginley Dynamic Moving Average indicator, a type of moving average that was designed to track the market better than existing moving average indicators. It is a technical indicator that improves upon moving average lines by adjusting for shifts in market speed.
Moving averages used:
EMA: 21
EMA: 42
The chart used for the backtest was the Bovespa Futures Index ( WIN1! Continuous: current contract in front )


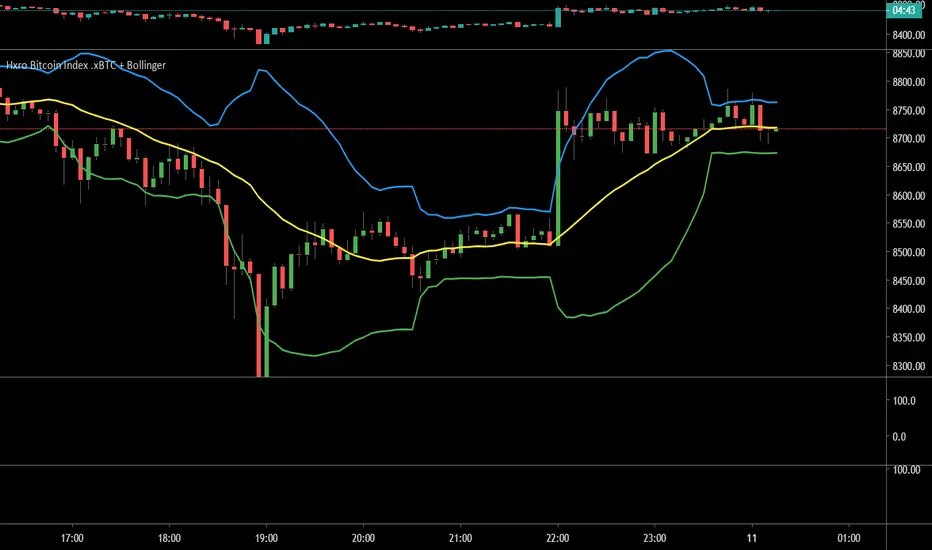
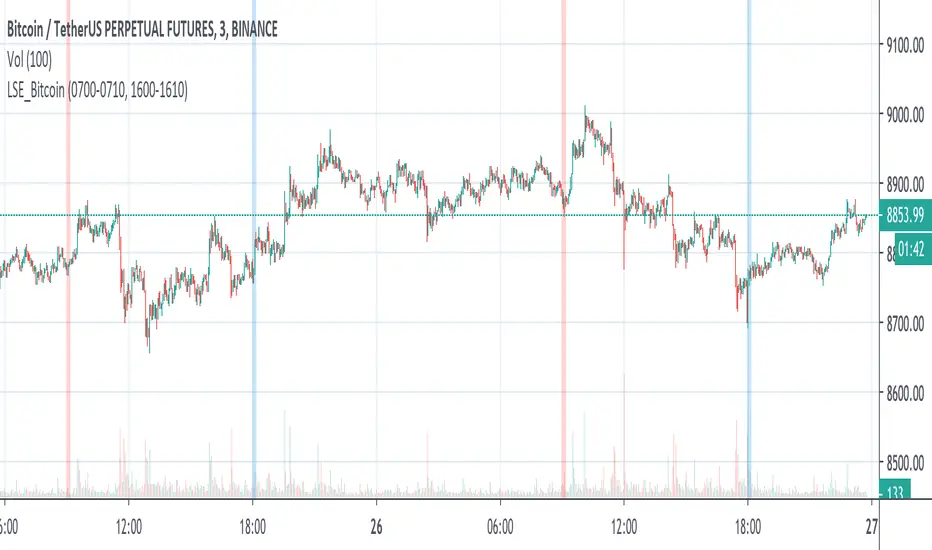
LSE_Bitcoin pump and flush at the London SE opening and closingBTC recently decoupled from SPX but now it is using London Exchange opening and closing hour to pump and flush.
Week Start - Highlights the first candle of the weekSome users asked in PM about a script that highlights the start of the week. Consequently, I decided to publish it open for anyone finding it useful.
Furthermore, I will update the script soon with more useful features and customisation options.

Revolution RSI Multi Asset PerformanceUse this indicator to get a nice and easy view of the relative performance of the assets you're trading. I personally set length to 200 to get a long-term understanding of relative performance.

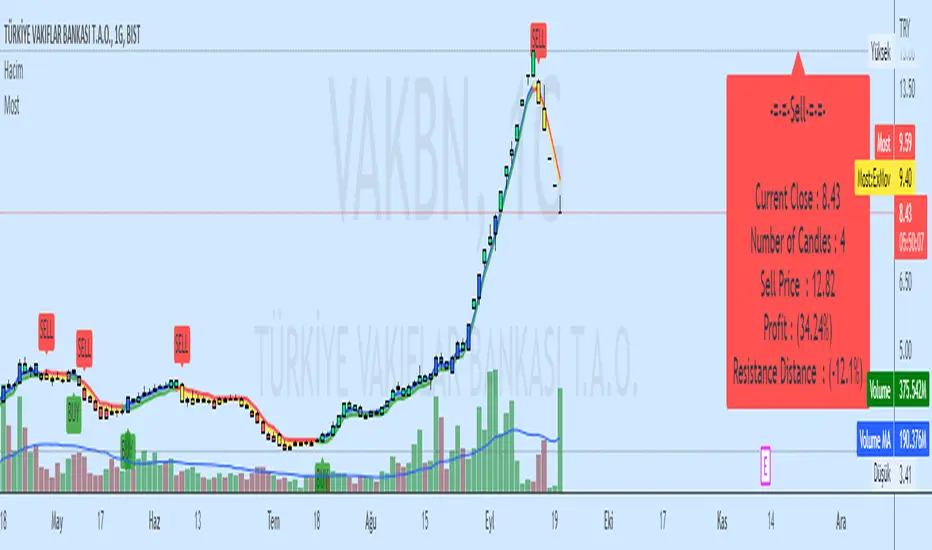
Moving Stop Loss (Most) by ceyhunATR is an indicator that has been removed and replaced with a moving average.Bar colors and infopanel have been added.
//Barcolor
Green = ExMov > Most and close > Most and low > Most
Blue = ExMov > Most and close > Most and low < Most
Red = Most > ExMov and close < Most and high < Most
Yellow = Most > ExMov and close < Most and high > Most
//It gives White color where there is deterioration.
//InfoPanel
Buy Price = Blue draws the circles at the purchase price.
Profit Long>20 = Risk level taken as a percentage, I got the highest 20%, you can determine as you wish.
Sell Price = Red draws the circles at the purchase price.
Profit Short>20 = Risk level taken as a percentage, I got the highest 20%, you can determine as you wish.
==Atr Original Code==
CDC ATR Trailing Stop V2.1 (2013)
==Most Code==
MOST by Anıl ÖZEKŞİ
Barcolor
Barcolor