Candlestick Analysis
Real Price for Heikin Ashi ChartsThe indicator is in the top left of the screen! That's all there is, by design.
This is a super simple indicator that allows you to see what the real price of a candle was when using Heikin Ashi charts, while not cluttering up your screen.
HA charts are a great way to help those who can be spooked by the chaos of the markets (I'm one!), but they have a big drawback in that the price you see on a HA candle is often significantly different from the real price that you would trade on. This brings issues of unrealistic expectations of profits/losses, and also makes back testing a strategy very difficult. I still wouldn't recommend ever using TradingView's "strategy" tool when using HA charts, but using this indicator you can do accurate manual back tests.
There's nothing plotted on the screen given that there's no real point in it, but you can make the lines appear if you wish - just go into settings and change the transparency.
The order of the numbers on the indicator match the OHLC (Open, High, Low, Close) format.
There's also settings to turn off one or more of the OHLC values, simply open the settings and go to Inputs. This could be useful for some people, as the High and Low values of HA candles are the same as regular candles. Only the Open and Close are different.
Any queries let me know.
DreamsDefined

Range ColumnsQuite simple, this plots the range of each candle (high - low). My main intention for this study is for weekly or monthly NG1! .

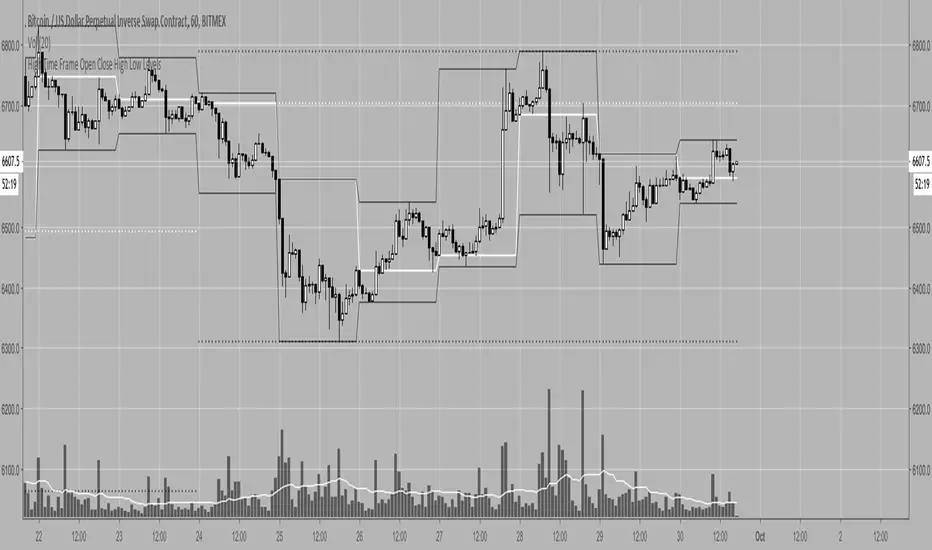
High Time Frame Open Close High Low LevelsGives you the OHLC levels of the weekly and daily candles as levels in whatever timeframe you're on so you can have a macro view in lower timeframes without having to switch timeframes constantly.
You may toggle the visibility of all the daily or weekly levels as well as each individual open/close/high/low.
The line styles and colors are customizable.
HDW open_close上位時間軸のロウソク足を表示したくて、それに代わるものが見つからなかったので作ってみました。
1時間足、日足、週足の 始値 と 終値 をラインで表示するものです。
ヒゲの部分は作っていません。実体を見て判断します。
【Google translate】
I wanted to display the candlestick on the upper time axis, so I could not find an alternative to it, so I made it.
It displays the start value and closing price of 1 hour foot, daily stick, weekly leg with a line.
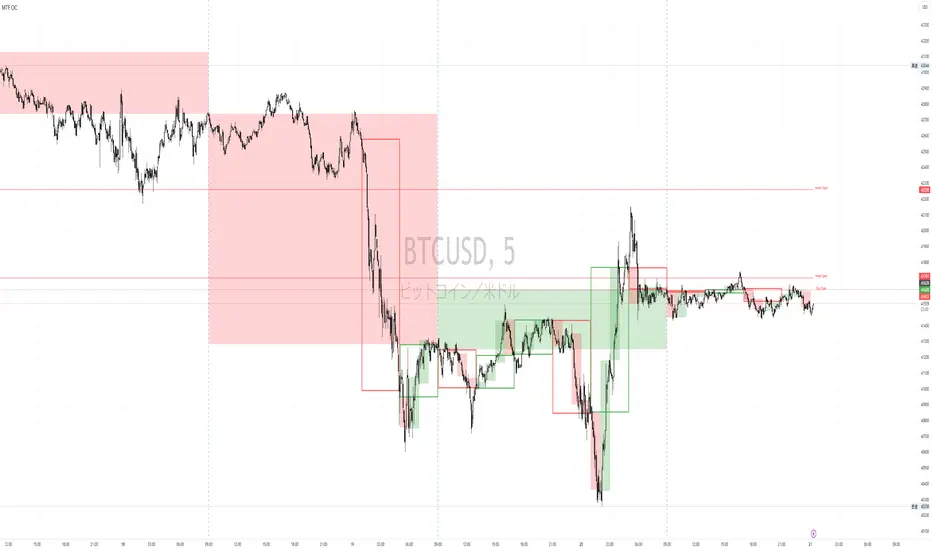
Trend Reversal Alerts Strategy [4H/3M]This is advanced version of T-R.A.S with better logic adapted for 4hour / 3month timeframes
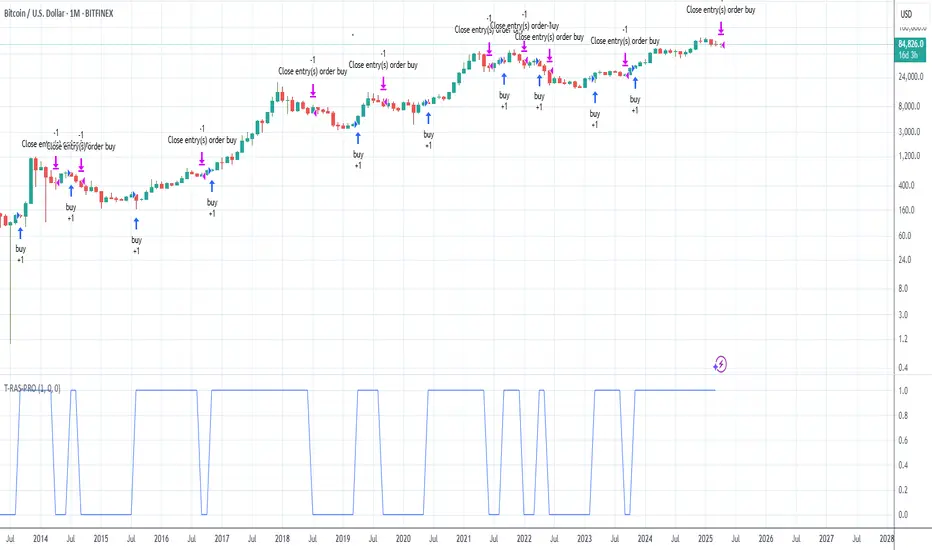
Trend Reversal Alerts Strategy [Advanced]This is a hourly version of T-R.A.S
It's better for houry timeframes : 2h, 3h, 4h, 6h, 12h, 1d, 4d ; otherwise use version for weekly

Trend Reversal Alerts Strategy [lite]This strategy was created as experimental and after playing around with it, I was able to realize what is a good way to base your strategy on and what is not.
This one is most primitive way and you should not expect gains from it(it's best on the weekly btw).
Anyway, all my attempts to advance this strategy in the end gave me around 1%2% +Net Profit on the hourly timeframe and drastically reduced the Net Profit by 50% on the weekly, so I think it is a waste of my time, but if you feel like you have ideas to share with me, please feel free to comments below!
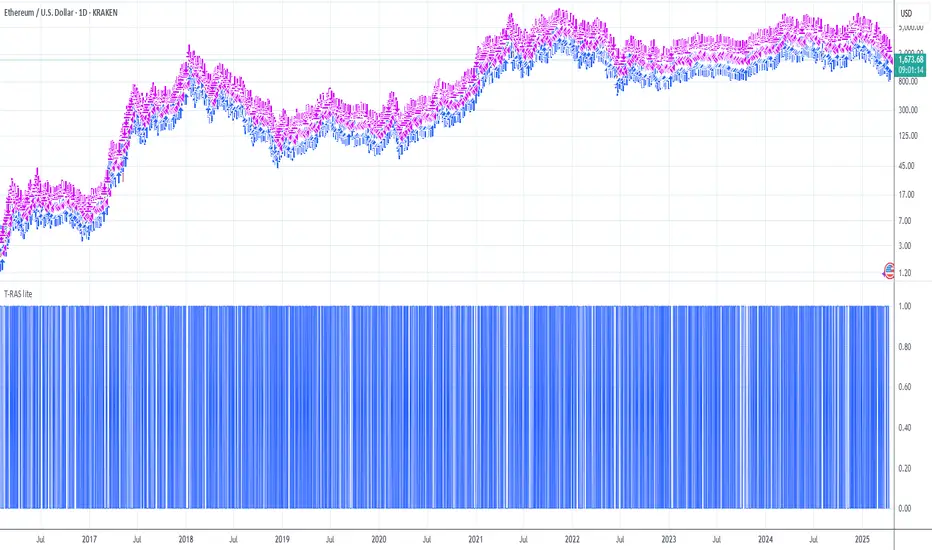
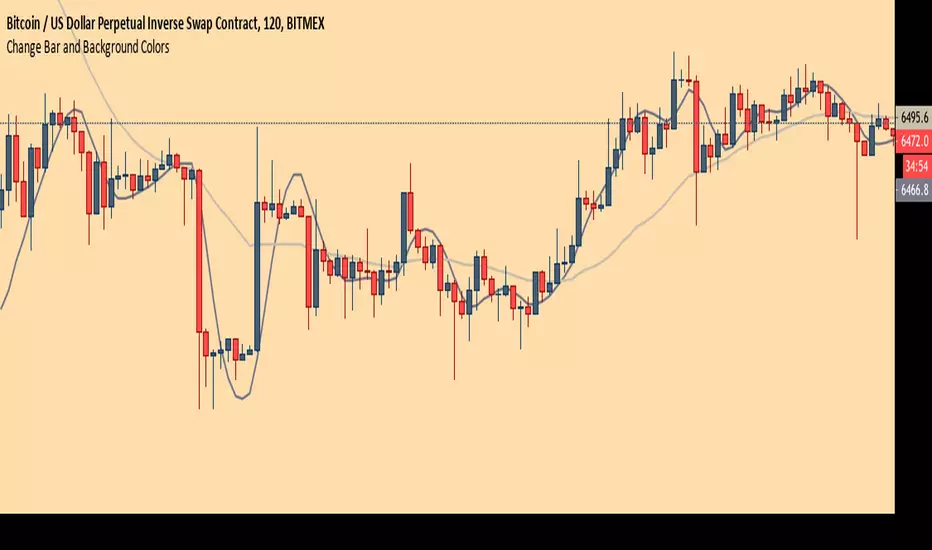
Chart Theme - Change Bar and Background Colors using HEX #sAdds aesthetic ability to charts by allowing the trader to change the color of the bars, background, and plots using HEX colors, rather than TradingView's limited color selector box. This makes for easy application of color palettes to charts. The color palettes can be saved as indicators and applied quickly, as desired.
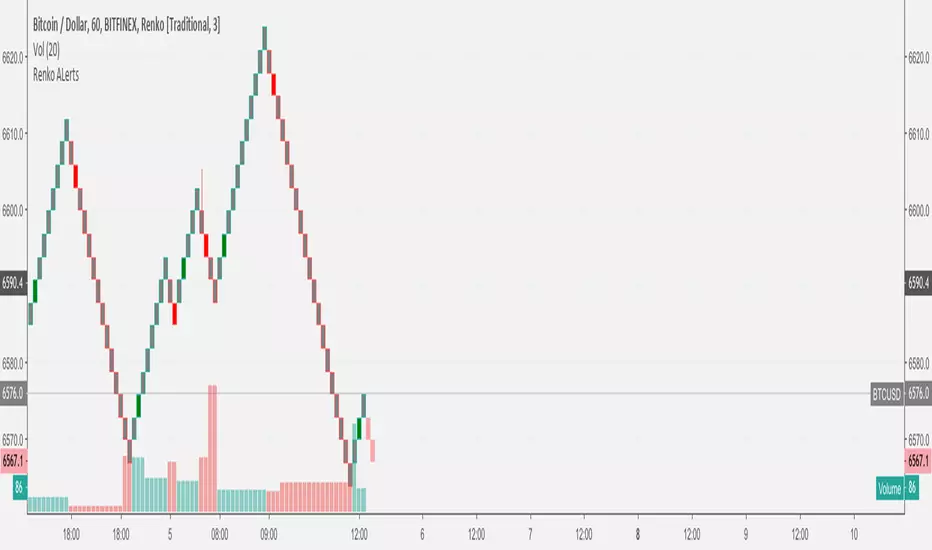
Kozlod - Heikin-Ashi Bar Color Change StrategyYou can use this script to backtest Heikin-Ashi bar color change strategy.
You have to apply this script to usual candles and not Heikin-Ashi!!!
Background color indicates HA bar color. On change you'll see green/red arrows and alert will be fired.
Also you can find in the code calculations of all HA OHLC values.


MACD (Moving Average Convergence/Divergence) + Inside BarMACD (Moving Average Convergence/Divergence) + Inside Bar so that free users can have two things in same indicator.
Script is open for everyone.
Check and test the code of Inside Bar and let me know if it is correct.
Feel feel to share.

Bithumb Ticker USD/BTC PairConverts Bithumb tickers into USD or bitcoin pairings from KRW.
This currently uses the FX pair to convert. There is an option to toggle between candlesticks and line.

Kozlod - Heikin-Ashi Bar Color Change AlertsYou can use this script to setup alerts on Heikin-Ashi bar color change.
You have to apply this script to usual candles and not Heikin-Ashi!!!
Background color indicates HA bar color. On change you'll see green/red arrows and alert will be fired.
Also you can find in the code calculations of all HA OHLC values.