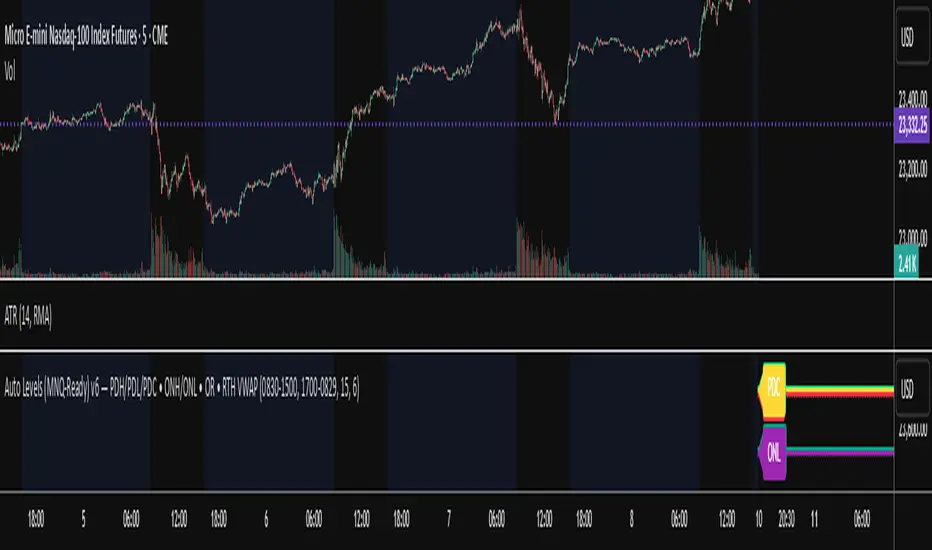
Institutional level Indicator V5Smart money concept indicator with added VWAP for better understanding for fair price with relation to movement of price.
Candlestick analysis

Engulfing & Pin Bar Breakout StrategyOverview
This strategy automates a classic, powerful trading methodology based on identifying key candlestick reversal patterns and trading the subsequent price breakout. It is designed to be a complete, "set-and-go" system with built-in risk and position size management.
The core logic operates on the 1-Hour timeframe, scanning for four distinct high-probability reversal signals: two bullish and two bearish. An entry is only triggered when the market confirms the signal by breaking a key price level, aiming to capture momentum following a potential shift in market sentiment.
The Strategy Logic
The system is composed of two distinct modules: Bullish (Long) and Bearish (Short).
🐂 Bullish (Long) Setup
The script initiates a long trade based on the following strict criteria:
Signal: Identifies either a Hammer or a Bullish Engulfing pattern. These patterns often indicate that sellers are losing control and buyers are stepping in.
Confirmation: Waits for the very next candle after the signal.
Entry Trigger: A long position is automatically opened as soon as the price breaks above the high of the signal candle.
Stop Loss: Immediately set just below the low of the signal candle.
Take Profit: A fixed target is placed at a 1:5 Risk/Reward Ratio.
🐻 Bearish (Short) Setup
The script initiates a short trade based on the following strict criteria:
Signal: Identifies either a Shooting Star or a Bearish Engulfing pattern. These patterns suggest buying pressure is fading and sellers are taking over.
Confirmation: Waits for the very next candle after the signal.
Entry Trigger: A short position is automatically opened as soon as the price breaks below the low of the signal candle.
Stop Loss: Immediately set just above the high of the signal candle.
Take Profit: A fixed target is placed at a 1:4 Risk/Reward Ratio.
Key Feature: Automated Risk Management
This strategy is designed for disciplined trading. You do not need to calculate position sizes manually.
Fixed Risk: The script automatically calculates the correct position size to risk exactly 2% of your total account equity on every single trade.
Dynamic Sizing: The position size will adjust based on the distance between your entry price and your stop loss for each specific setup, ensuring a consistent risk profile.
How To Use
Apply the script to your chosen chart (e.g., BTC/USD).
Crucially, set your chart's timeframe to 1-Hour (H1). The strategy is specifically calibrated for this interval.
Navigate to the "Strategy Tester" tab below your chart to view backtest results, including net profit, win rate, and individual trades.
Disclaimer: This script is provided for educational and informational purposes only. It is not financial advice. All trading involves substantial risk, and past performance is not indicative of future results. Please use this tool responsibly and at your own risk.

Engulfing + Sweep (Confirmed Only) v6 — bars onlyMarks bullish/bearish engulfing candles with liquidity sweeps and confirms them on the next candle — no repaint.
✳️ Features:
• 🟩 Bullish Engulfing + Low Sweep
• 🟥 Bearish Engulfing + High Sweep
• 🎛 Require opposite-color previous candle (optional)
• 📏 Min body-to-range filter
• 🔔 Alerts on confirmation candle
🎯 Best for:
• Price action & reversal traders
• Liquidity sweep confluence setups

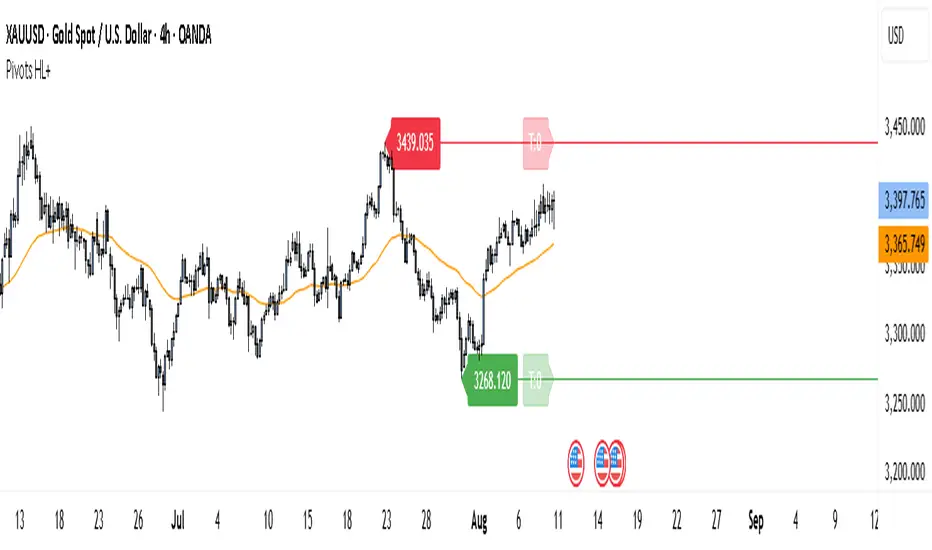
Pivot Points HL DetailedThis indicator marks important turning points in the market, showing you the most recent swing high and swing low as horizontal lines across the chart. Each pivot line has a price label where it formed and a small counter that updates whenever the market touches that level again. The line’s color reflects the prevailing trend, determined by an EMA filter, so you can quickly see if the level is likely acting as support or resistance in the current market environment.
It works by scanning recent bars for points where price made a local high higher than several bars to its left and right, or a local low lower than several bars to its left and right. These pivots are calculated directly from price action using the ta.pivothigh and ta.pivotlow functions. Once identified, the level is tracked in real time, counting every time price crosses it. The EMA provides context: if price is above the EMA, the market is considered in an uptrend and the pivots are colored to match; if price is below, they’re marked as part of a downtrend.
For traders, this offers a clean way to see where the market has turned before and whether those levels are still relevant. Strong levels often show multiple touches, which can be used for entries, exits, or risk management. The built-in alert system can notify you when price approaches either the most recent swing high or swing low, so you can react quickly.
This tool can be applied in almost any market — forex, stocks, indices, commodities, or crypto — because price tends to respect recent swing points regardless of the asset class. It tends to be most effective in liquid markets, where many traders see and react to the same key levels, and it’s valuable in both trending and ranging conditions, though the EMA trend filter adds extra clarity when the market is moving directionally.
ICT/SMC Liquidity Map V3 KyroowThe indicator is designed to map liquidity on the chart following the ICT/SMC logic, with the added feature of precise tracking of the Asian session.
It shows you:
PDH / PDL → Previous Day High & Low, automatically removed once taken out.
EQH / EQL → Equal Highs & Equal Lows (double tops/bottoms), with pip tolerance and a check to ensure no candle has already "cleared" the range.
ASH / ASL → Asian Session High & Low (the highs/lows of each closed Asian session).
Asian Session → Displayed as a box or shaded area, with visual history.
Dynamic tolerance management → EQH/EQL can have different tolerances depending on the timeframe.
Automatic removal → Levels are removed once the market takes them (via wick or body, configurable).
💡 In practice:
It helps you quickly identify likely liquidity grab zones, whether they come from the previous day, the Asian session, or equal highs/lows. This allows you to anticipate market reactions around these levels.

X σ mirrorX σ Mirror — Volatility Projection & Price Action Guide
The X σ Mirror is a volatility-mapping tool that measures the prior period’s trading range, then mirrors and projects that range onto the current period. Anchored from the current period’s opening price, the indicator divides this projected range into quartiles, creating a structured price map that adapts to the asset’s recent volatility profile.
Core Methodology
Range Measurement – At the close of each user-selected higher timeframe (daily, 4-hour, weekly, etc.), the indicator captures the prior period’s high, low, and midpoint (equilibrium). This defines the “volatility envelope” for the next period.
Projection from the Open – The full prior range is projected above and below the current period’s open. This symmetrical mirroring anchors the volatility measurement to a logical starting point for intraperiod price movement.
Quartile Breakdown – The projected range is segmented into precise increments: 0.25×, 0.50×, 0.75×, 1.0×, 1.25×, 1.5×, and 2.0× of the prior range. These serve as price “checkpoints” that reflect proportional expansions or contractions relative to historical volatility.
How It Guides Price Action
Dynamic Support & Resistance – Quartile levels often act as temporary barriers or accelerators for price movement, highlighting areas where order flow may cluster.
Momentum Tracking – Price acceptance above successive quartiles suggests sustained directional strength, while repeated failures to breach a quartile indicate exhaustion.
Risk Management – The mirrored range and quartile levels help traders size positions, define stop placements, and set profit targets with volatility-adjusted precision.
Market Context – By anchoring the projection from the open, the indicator aligns volatility expectations with the session’s actual market structure, rather than static fixed levels.
Application
The X σ Mirror is adaptable across assets and timeframes, making it suitable for intraday traders tracking the unfolding session, as well as swing traders monitoring multi-day expansion potential. By combining historical range analysis with real-time market positioning, it provides a balanced framework for anticipating price behavior within a probabilistic structure.

STOCH MTF【15M/1H/4H】 EMOJI And Chart TableStochastic Oscillator (MT4/MT5 Function) Numerical Value with Chart Table , Emoji Overlay with Chart OverLay , You Can Find Best way to Trade with New Trend Line Start , i Suggest using with this indicator 【STOCH RSI AND RSI BUY/SELL Signals with MACD】
=================================================
Find Signal with 4H and 1H and looking for Entry Point In 5 Min / 15 Min。
Before Trend Start Tell you to Notify

Premium Fibonacci Entry Bands [Mark804 Pro]🚀 Premium Fibonacci Entry Bands Pro - Advanced Trading System for TradingView 🚀
Unlock Precision Trading with Smart Fibonacci Zones + Volume-Confirmed Signals!
🔥 Why This Indicator Stands Out:
✅ Multi-Layer Confirmation: Combines Fibonacci bands, trend analysis, and volume spikes for high-probability entries
✅ 3-Stage Signal System: Aggressive (A), Strong (S), and Exit signals for optimal risk management
✅ Institutional-Grade Filters: 200 EMA trend filter + volume confirmation reduces false signals
✅ Visual Hierarchy: Color-coded bands + distinct shapes (▲ ▼ ✖) for instant signal recognition
✅ Fully Customizable: Adjust sensitivity, toggle features, and adapt to any trading style
💡 Perfect For:
• Swing traders looking for mean-reversion opportunities
• Trend followers wanting confirmed breakouts
• Day traders needing clear entry/exit levels
• Risk-averse investors using the built-in exit system
📈 How It Works:
Fibonacci Bands identify overextended price levels
Trend Filter keeps you trading in the right direction
Volume Spikes confirm strong institutional participation
Smart Exits lock in profits before reversals
🔍 SEO-Optimized Keywords:
"Best Fibonacci Trading Indicator", "Smart Mean Reversion Strategy", "Volume Confirmed Trading Signals", "Professional TradingView Tools", "Trend Following System", "Low Risk Entry Points", "Institutional Trading Algorithm", "Swing Trading Indicator", "Day Trading Signals", "Price Action Confirmation"
✨ Why Traders Love It:
"Finally a Fibonacci indicator that combines math with market context! The volume confirmation makes all the difference." - Verified User
📲 Get an Edge in Any Market Condition!
👉 Install Now to transform how you trade with institution-grade confirmation logic 👈
🔗 Pro Tip: Pair with RSI or MACD for even higher accuracy in ranging markets!

Prev D/W/M + Asia & London Levels [Oeditrades]Prev D/W/M + Asia & London Levels
Author: Oeditrades
Platform: Pine Script® v6
What it does
Plots only the most recent, fully completed:
Previous Day / Week / Month highs & lows
Asia and London session highs & lows
Levels are drawn as true horizontal lines from the period/session start and extended to the right for easy confluence reading. The script is non-repainting.
How it works
Prev Day/Week/Month: Uses completed HTF candles (high / low ) so values are fixed for the entire next period.
Sessions (NY time): Asia (default 20:00–03:00) and London (default 03:00–08:00) are tracked in America/New_York time. High/low are locked when the session ends, and the line is anchored at that session’s start.
Inputs & customization
Visibility: toggle Previous Day/Week/Month, Asia, London, and labels.
Colors: highs default red; lows default green (user-configurable). Session highs default pink, lows aqua (also editable).
Style: line style (solid/dotted/dashed) and width.
Sessions: editable time windows for Asia and London (still interpreted in New York time).
Disclaimer: optional on-chart disclaimer panel with editable text.
Notes
Works on any timeframe. For intraday charts, the HTF values remain constant until the next HTF bar completes.
If your market’s overnight hours differ, simply adjust the session windows in Inputs.
Lines intentionally show only the latest completed period/session to keep charts clean.
Use cases
Quick view of PDH/PDL, PWH/PWL, PMH/PML for bias and liquidity.
Intraday planning around Asia/London range breaks, retests, and overlaps with prior levels.
Disclaimer
This tool is for educational purposes only and is not financial advice. Markets involve risk; past performance does not guarantee future results.

Opening Range BreakoutThis indicator is designed for Opening Range Breakout (ORB) traders who want automatic calculation of breakout levels and multiple price targets.
It is optimised for NSE intraday trading, capturing the first 15-minute range from 09:15 to 09:30 and plotting key breakout targets for both long and short trades.
✨ Features:
Automatic daily reset — fresh levels are calculated every trading day.
Opening Range High & Low plotted immediately after 09:30.
Two profit targets for both Buy & Sell breakouts based on the opening range size:
T1 = 100% of range added/subtracted from OR high/low.
T2 = 200% of range added/subtracted from OR high/low.
Clear breakout signals (BUY / SELL labels) when price crosses the OR High or Low.
Custom alerts for both buy and sell triggers.
Designed to work on any intraday timeframe (1min, 3min, 5min, etc.).
📊 How it works:
From 09:15 to 09:30, the script records the highest and lowest prices.
At 09:30, the range is locked in and breakout targets are calculated automatically.
Buy and Sell signals are generated when price breaks above the OR High or below the OR Low.
Targets and range lines automatically reset for the next day.
⚠️ Notes:
This script is tuned for NSE market timings but can be adapted for other markets by changing the session input.
Works best on intraday charts for active traders.
This is not financial advice — always backtest before trading live.

X OR AVWAPX OR AVWAP is a multi-layered market mapping tool designed to combine Opening Range analysis, Anchored VWAP (AVWAP) positioning, and SMA markers into a unified visual framework.
Opening Range (OR) Mapping
The indicator supports two independent Opening Ranges, allowing traders to define both a primary range and a micro range for finer analysis. This is particularly effective when viewing lower timeframes, where a smaller OR inside the larger OR reveals intraday microstructure.
OR #1 and OR #2 each have configurable session times, colors, and optional midpoint lines.
Historical OR boxes can be shown or hidden, with the ability to extend levels forward in time.
Optional Fibonacci-based expansion levels (0.5x, 1x, 1.5x, 2x, 3x OR) are available for projecting breakout targets and retracement zones.
Traders can toggle high/low lines, midpoints, and labels independently for cleaner chart presentation.
Anchored VWAP (AVWAP) Layers
To track institutional capital flow and session bias, the indicator offers three separate AVWAP anchors, each independently controlled:
Can be anchored to custom events, sessions, or manual reference points.
Enables granular capital flow mapping down to 4-hour increments, helping traders align intraday trades with broader directional bias.
Each AVWAP can be toggled on/off to avoid clutter and isolate the most relevant flow line for the current setup.
SMA Markers
For additional context, simple moving average markers can be displayed alongside OR and AVWAP structure, helping gauge trend direction and mean-reversion potential.
Use Case
This tool is built for traders who want to combine structure, flow, and trend in a single view. On lower timeframes, the dual OR feature allows for a “range-within-a-range” perspective, revealing short-term liquidity pockets inside the day’s primary auction boundaries. The multi-anchor AVWAPs track how price interacts with session-based weighted averages, highlighting points where institutional bias may shift. When combined with SMA markers, the trader gains a comprehensive map for scalping, intraday swing trading, and capital flow tracking.

BTC Multi-Session Open Breakout with Dynamic Sensitivitybtc tool using algo detection and a dynamic sensitivity tool to avoid breakouts and see-saw action. First draft.
ICT SMC Custom — BOS/MSS + OB + FVGWant me to fill that box? Here’s a ready‑to‑paste description for your publish screen:
⸻
ICT SMC Custom — BOS/MSS + OB + FVG (Crypto‑friendly)
A clean Smart Money Concepts tool that marks Break of Structure (BOS), Market Structure Shift (MSS), Order Blocks (OB), and Fair Value Gaps (FVG) with bold, easy‑to‑see visuals. Built for crypto but works on any market and timeframe.
What it does
• BOS & MSS detection with optional body/wick logic
• Order Blocks: auto‑draws the last opposite candle before a BOS, keeps only the most recent N, and fades when mitigated
• FVGs: 3‑candle gaps with a minimum size filter and a cap on how many to keep
• HTF Swings (optional): plots higher‑timeframe pivot highs/lows for top‑down context
• Alerts for BOS/MSS and FVG formation
Inputs
• Swing pivot length (default 3): sensitivity for structure pivots
• Use candle bodies for breaks: close vs level (on) or wicks (off)
• Show BOS/MSS labels, Show FVG, Show Order Blocks
• Min FVG size (ticks) and Max boxes to keep for FVG/OB
• OB uses candle body: body range vs full wick range
• Show higher timeframe swings + HTF timeframe
• Bullish/Bearish colors
How it works
• BOS triggers when price breaks the last opposite swing.
• MSS flags when the break flips the prior bias.
• OB is the most recent opposite candle prior to BOS; it’s marked and later greyed out once price closes through it (mitigation).
• FVG is detected when candle 1’s high < candle 3’s low (bear) or candle 1’s low > candle 3’s high (bull).
Alerts included
• BOS Up / BOS Down
• MSS Up / MSS Down
• FVG Up / FVG Down
Tips
• Start on 15m/1h for crypto, pivot length 3–5.
• Turn Use candle bodies ON for stricter confirmations, OFF for more signals.
• If boxes look cluttered, lower “Max boxes to keep.”
Note: This is a visual/educational tool, not financial advice. Always confirm with your own plan and risk management.

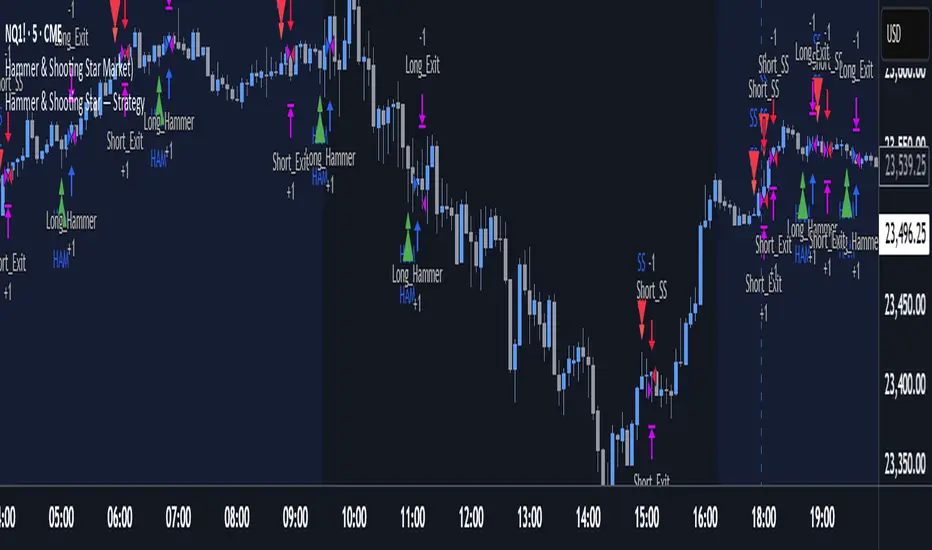
Hammer & Shooting Star — StrategyHammer & Shooting Star Strategy for Intraday Trading
This strategy identifies two candlestick patterns commonly used in technical analysis:
Hammer Candles (a bullish reversal signal):
A hammer candle has a small body at the top with a long lower wick. The strategy goes long on the next bar open when a hammer is detected, with a stop loss at the low of the hammer bar and a target at the high.
Shooting Star Candles (a bearish reversal signal):
A shooting star candle has a small body at the bottom with a long upper wick. The strategy goes short on the next bar open when a shooting star is detected, with a stop loss at the high of the shooting star bar and a target at the low.
Hull Suite Strategy – 1% Risk, No SL/TP Catch trends early. Exit only on reversal.
This Hull Suite Strategy uses ultra-smooth HMA, EHMA, or THMA signals to ride big moves with minimal noise. Risk just 1% per trade, keep positions open until the market truly flips — no premature exits, no guesswork.
Hull Suite Strategy – 1% Risk (No SL/TP)
A clean trend-following system built on the Hull Moving Average and its powerful variations (HMA, EHMA, THMA) for fast, smooth, and low-lag signals. The strategy automatically flips between long and short positions based on trend reversals, using just 1% equity risk per trade.
Features:
Hull Variations – test HMA, EHMA, or THMA for your market.
Automatic Trend Switching – enter and exit only on confirmed reversals.
No Fixed SL/TP – ride trends as long as they last.
Optional Trend-Colored Candles – for quick, visual market direction.
Clear Bull/Bear Line Coloring – instantly see the trend bias.
Perfect for traders who prefer to let winners run and avoid fixed take profit limits, with a focus on pure trend action and minimal lag.

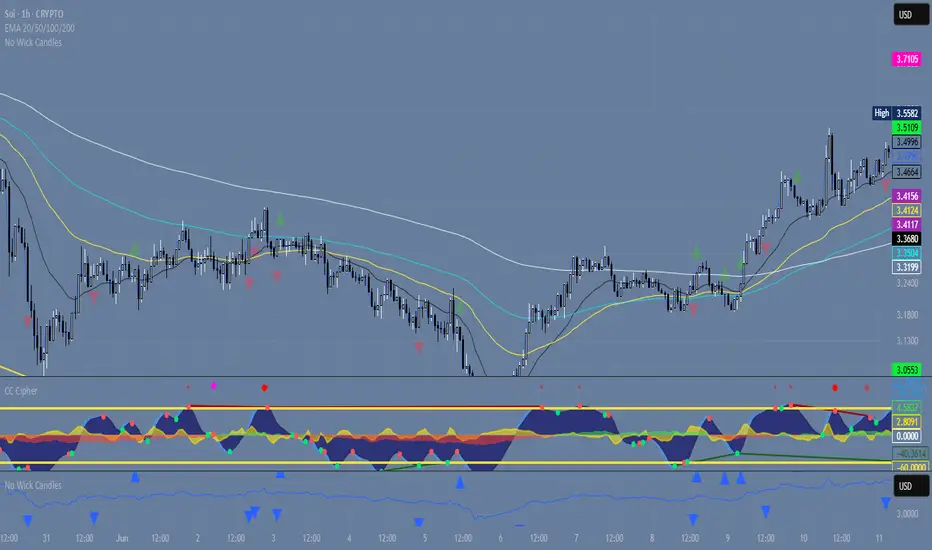
Volume Breakout Candle Signals(Mastersinnifty)Description
The Volume Breakout Candle Signals indicator highlights price candles that occur with unusually high volume compared to recent history. By combining a moving average of volume with a user-defined breakout multiplier, it identifies bullish and bearish breakout candles and marks them directly on the chart.
How It Works
Calculates a Simple Moving Average (SMA) of volume over a user-selected period.
Compares current bar volume to the SMA multiplied by a breakout factor.
Flags candles as:
• Bullish breakout if volume is high and the candle closes higher than it opened.
• Bearish breakout if volume is high and the candle closes lower than it opened.
Marks breakout points with visual labels and background highlights for quick identification.
Inputs
Volume MA Length – Period for calculating the moving average of volume.
Breakout Multiplier – Factor above the average volume to qualify as a breakout.
Show Bullish Signals – Toggle bullish breakout labels.
Show Bearish Signals – Toggle bearish breakout labels.
Use Case
Identify potential breakout opportunities driven by significant market participation.
Spot volume surges that may precede trend continuation or reversals.
Combine with price action or other indicators for confirmation.
Useful for intraday scalping, swing trading, and breakout strategies.
Disclaimer
This tool is intended for educational purposes only and should not be considered financial advice. Trading involves risk, and past performance is not indicative of future results. Always perform your own analysis before making any trading decisions.

Candlestick Suite–(Phoenix) it colors the major Reversal candlesticks
BullEngulf or BearEngulf or Engulfing() -> DARK_ORANGE
PiercingLine or DarkCloudCover -> CYAN
BullishHarami or BearishHarami -> YELLOW
BullishInsideBar or BearishInsideBar -> WHITE

CP Strat ORBnew york opening range breakout and retest allows you to enter a trade with a better clarity if the price comes back and retest the range

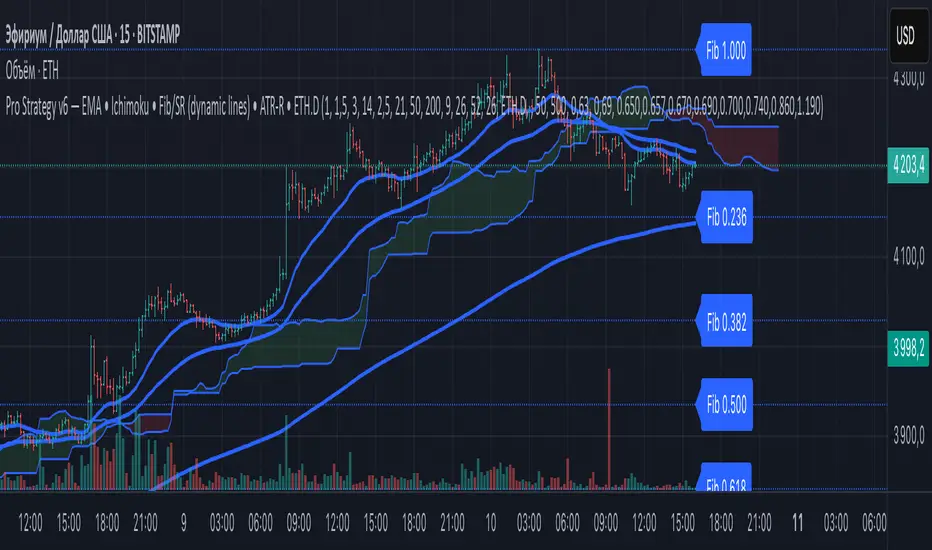
ZapTeam Pro Strategy v6 — EMA The Pro Strategy v6 script is a versatile trading strategy for TradingView that combines trend indicators, filters, and levels.
Main features:
EMA 21, EMA 50, EMA 200 — trend detection and entry signals via EMA crossovers.
Ichimoku Cloud (optional) — trend filtering and price position relative to the cloud.
ETH Dominance filter (optional) — filters trades based on Ethereum dominance (ETH.D).
ATR Stop-Loss — dynamic stop-loss based on volatility.
Two take-profits (TP1 and TP2) with optional 50/50 split.
Dynamic Fibonacci Levels — automatic or manual swings, with 1.272 and 1.618 extensions.
Custom S/R Levels — user-defined support/resistance levels.
Level lines extend across the chart and automatically adjust when zooming or panning.
Designed for trading in trending market conditions on any timeframe.
The strategy calculates position size based on percentage risk per equity.
Wickless Precision IndicatorThe Wickless Precision Indicator is a powerful tool designed to identify and highlight wickless and tailless candlestick patterns on your TradingView charts. A wickless candle, where the open or close price equals the high or low, signals strong directional momentum and potential support or resistance levels. This indicator automatically detects these unique candles, drawing customizable horizontal lines at their key price levels to help traders spot critical zones for entries, exits, or reversals.
Key Features:
Automatic Wickless Detection: Identifies bullish (no lower wick) and bearish (no upper wick) candles with precision.
Dynamic Line Plotting: Draws horizontal lines at the high or low of wickless candles, extending until price interaction or user-defined conditions.
Customizable Settings: Adjust line styles, colors, and sensitivity thresholds to suit your trading style.
Visual Markers: Highlights wickless candles with distinct shapes (e.g., triangles or crosses) for easy identification.
Alert Integration: Set real-time alerts to stay notified when wickless candles form, ensuring you never miss a potential trading opportunity.
Use Cases:
Pinpoint strong support/resistance zones where price rejection is evident.
Identify high-probability entry or exit points based on momentum-driven candles.
Enhance price action strategies with clear visual cues for market sentiment shifts.
Perfect for traders seeking to capitalize on clean, wickless price movements, the Wickless Precision Indicator simplifies technical analysis and boosts trading confidence.
xmtr's session highs/lowsMarks Asia & London session highs/lows with precision + PDH/PDL for daily context. Fully customizable & perfect for all traders.

1H MA20 Downbreak Alert1H MA20 Downbreak Alert
1H MA20 Downbreak Alert1H MA20 Downbreak Alert1H MA20 Downbreak Alert