Multi-Timeframe Price Action AnalysisMulti-Timeframe Price Action Analysis
This indicator analyzes price action across multiple timeframes to determine bullish and bearish signals. It creates a dashboard showing how price interacts with previous candles' highs and lows.
Features
- Analyzes 4 customizable timeframes simultaneously
- Detects when price:
-- Grabs lows and comes back inside (bullish)
-- Grabs highs and comes back inside (bearish)
-- Grabs both highs and lows
-- Moves above previous high
-- Moves below previous low
-- Calculates bullish/bearish percentages for each timeframe
-- Visual dashboard with color-coded signals
Adjustable confirmation settings
-- Settings
-- Customize timeframes (default: 15min, 1H, 4H, D)
-- Toggle confirmation waiting
-- Set number of confirmation candles
This is a very rudimentary version.. I will make a more robust version soon
For it to be considered a "grab" the current price must be within the previous candle's range..
This also does not focus on candle closures just highs and lows
Also note that this is a little aggressive in that it does not require a bullish close for example to be considered bullish, a bearish close inside the previous candle is considered valid, this is to handle the morning stars that have a slightly bearish close in middle candle etc.. obviously do not rely on this indicator.. look at the price action and determine if you think its worth taking..
Same goes for bullish closes inside previous candle after grabbing highs..
Candlestick analysis

Candle Ribbon [UkutaLabs]The Candle Ribbon is a powerful trading tool that creates a strong ribbon that indicates market strength. This ribbon is created using three moving averages that use the candle values (high, low, open and close) as its input values.
The center most MA will also be colored green, red or grey depending on whether or not its direction aligns with current market strength.
The outer band lines act as range indicators, plotted above and below the center ribbon, which represent volatility boundaries for price action.
█ USAGE
The Candle Ribbon is created using a series of three moving averages that uses values from the candle as its inputs. The user has the ability to select whether the moving averages are EMAs or SMAs, as well as the ability to control the period of the moving averages.
If the moving average calculated using the Candle Open is below the moving average calculated using the Candle Close, the ribbon will be colored green, indicating a bullish trend. If the moving average calculated using the Candle Open is above the moving average calculated using the Candle Open, the ribbon will be colored red, indicating a bearish trend.
This indicator also uses a series of hidden EMAs to determine market strength. If these EMAs do not align with the direction of the Candle Ribbon, the middle MA will instead be colored grey, indicating uncertainty in the market, as well as a possible reversal.
█ SETTINGS
Configuration
• Moving Average Type: Determines whether or not the Candle Moving Averages will be drawn as EMAs or SMAs.
• Moving Average Period: Determines the period of the Candle Moving Averages.
Moving Average
• Moving Average Input: Determines the input values for the hidden EMAs.

CHoCH + BOS Detector (con líneas)este indicador sirve para simplificar las entrada scalper en el oro

Engulfing Candles (ATR-Based) with Volume SpikeOverview:
This script is designed to detect high-probability bullish and bearish engulfing patterns — but with a twist: it filters them through ATR-based volatility and confirms strength with volume spikes, all while offering optional trend filtering. It's built for traders who want more than just surface-level candle patterns — it's for those who want contextual confirmation before entering a trade.
What Makes It Different:
Most engulfing candle indicators simply match two candle shapes. This script goes deeper by:
Measuring candle body size relative to recent volatility (via ATR).
Checking for volume confirmation using a dynamic spike threshold.
Filtering based on trend context using SMA-based structure detection.
This tri-layered logic aims to avoid false positives and give traders cleaner, more actionable entries that align with momentum.
Core Concepts:
1. Trend Detection (Optional)
You can choose between two structural filters:
SMA50 only: Looks for price above or below the 50-period SMA to define trend direction.
SMA50 + SMA200 alignment: A stricter rule requiring both fast and slow SMAs to confirm a trend.
Or turn off trend filtering entirely (No detection).
This helps ensure engulfing setups appear in line with the broader trend, increasing the likelihood of continuation.
2. ATR-Filtered Candle Bodies
To eliminate noise:
A candle is only considered a valid engulfing candle if it has a body larger than 1.5× ATR(14).
The previous candle must be a small-bodied candle (less than 0.5× ATR), creating a clear visual engulfing structure.
This method dynamically adjusts for market volatility, so setups are meaningful even during periods of compression or expansion.
3. Volume Spike Confirmation
Not all engulfing candles lead to follow-through. That’s why this script includes a volume confirmation filter:
A 20-period moving average of volume is calculated.
A spike is flagged if the current bar’s volume exceeds 1.5× this average (adjustable).
Patterns with this confirmation are marked with a “*” label (e.g., BU* or BE*) to distinguish volume-backed setups from weaker ones.
Visuals & Alerts:
BU = Bullish engulfing without volume spike
BU* = Bullish engulfing with volume spike
BE = Bearish engulfing without volume spike
BE* = Bearish engulfing with volume spike
A white background highlight is shown behind candles with volume-confirmed engulfing patterns.
Alerts are available for BU* and BE* so you can automate your edge.
How to Use:
Add the indicator to any chart.
Choose your trend filter from the settings panel.
Watch for BU* and BE* labels — these are your highest-conviction signals.
Optional: Combine with support/resistance, Fibonacci zones, or MTF confirmation to refine entries.
Use the included alerts to receive real-time push/email notifications when patterns emerge.
Performance Note:
I’ve found this script to be fairly good when applied to the 1-hour charts of the companies in the US100. The combination of ATR-based filtering and volume confirmation appears to provide clear, high-quality setups with good follow-through potential.
By blending candle patterns, volatility filtering, volume confirmation, and trend context, this script aims to filter out weak signals and highlight the most statistically significant engulfing opportunities.

Flexible Reversal DetectorFlexible Reversal Detector
An advanced, fully customizable analytical tool designed to identify local trend reversal zones based on candlestick formations. Users have full control over all logic parameters, making it adaptable to different trading styles and preferences.
Key Features
Adjustable maximum pattern length (number of candles)
Customizable body size ratios for initial, middle, and final candles
Configurable minimum price movement (in %) required before a pattern is considered valid
Colored horizontal lines showing the full length of the pattern – helpful in identifying structure, potential support/resistance zones
Optional volume filter – the volume of the final candle is compared to a volume SMA; multiplier can be adjusted (e.g. 1 = equal to average, 0.8 = 80% of average)
Logic Overview
U Pattern
Each bearish candle is treated as a potential start of a reversal pattern.
Subsequent candles, if small enough and within defined thresholds, form the middle part of the structure.
When a bullish candle with a sufficiently large body appears, it is marked as the final candle of the pattern.
The pattern is considered valid if it was preceded by a defined percentage price drop and – optionally – if the volume condition was met.
∩ Pattern
Each bullish candle may act as the initial candle of a potential reversal pattern in the opposite direction.
Following smaller candles form the middle part, as long as they meet the defined criteria.
The appearance of a strong bearish candle marks the end of the formation.
If this pattern is preceded by a certain price increase (and optionally meets the volume filter), it is highlighted on the chart.
Note: On markets with low volatility or on lower timeframes, it is recommended to reduce the percentage thresholds for signal detection. For more dynamic price action or higher timeframes, consider increasing them accordingly.
Visualization
The final candle of the pattern is marked visually on the chart (depending on direction)
Colored horizontal lines indicate the full span of the pattern – from initial to final candle

Trendline Breakouts With Volume Strength [TradeDots]Trendline Breakouts With Volume Strength is an innovative indicator designed to identify potential market turning points using pivot-based trendline detection and volume confirmation. By merging dynamic trendline analysis with multi-tiered volume filters, this tool helps traders quickly spot breakouts or breakdowns that may signal significant shifts in price action.
📝 HOW IT WORKS
1. Pivot-Based Trendline Detection
The script automatically scans for recent pivot highs and lows over a user-defined lookback period.
When it finds higher pivot lows, it plots green uptrend lines; when it finds lower pivot highs, it plots red downtrend lines.
These dynamic lines update as new pivots form, providing continuously refreshed trend guidance.
2. Volume Ratio Analysis
A moving average of volume is compared against the current bar’s volume to calculate a ratio (e.g., 1.5×, 2×).
Higher ratios suggest above-average volume, often interpreted as stronger participation.
The script applies color-coded cues to highlight the intensity of volume surges.
3. Breakout & Breakdown Detection
Each trendline is monitored for a defined “break threshold,” which helps avoid minor penetrations that can trigger premature signals.
When price closes beyond a threshold below an uptrend line, the indicator labels it a “BREAKDOWN.” If it closes above a threshold on a downtrend line, it labels it a “BREAKOUT.”
Volume surges accompanying these breaks are highlighted with contextual emojis and distinct color gradients for quick visual reference.
4. Trend Direction Table
A small on-chart table provides a snapshot of the current market trend—Uptrend, Downtrend, or Sideways—based on a simple moving average slope and the number of active uptrend or downtrend lines.
This table also displays quick stats on how many lines are actively tracked, helping traders assess the broader market posture at a glance.
🛠️ HOW TO USE
1. Choose a Timeframe
This script works on multiple timeframes. Intraday traders can monitor minute or hourly charts for frequent pivot updates, while swing and position traders may prefer daily or weekly intervals to reduce noise.
2. Observe Trendlines & Labels
Watch for newly drawn green/red lines connecting pivots.
When you see a “BREAKOUT” or “BREAKDOWN” label, confirm whether volume was abnormally high based on the ratio or color-coded bars.
3. Consult the Trend Table
Use the table in the bottom-right corner to quickly check if the market is trending or range-bound.
Look at the count of active uptrend vs. downtrend lines to gauge broader sentiment.
4. Employ Additional Analysis
Combine these signals with other tools (e.g., candlestick patterns, oscillators, or fundamental analysis).
Validate potential breakouts using standard techniques like retests or support/resistance checks.
❗️LIMITATIONS
Delayed Pivots: Trendlines only adjust once new pivot highs or lows form, which can introduce a slight lag in highly volatile environments.
Choppy Markets: Rapid, back-and-forth price moves may produce conflicting trendline signals and frequent breakouts/breakdowns.
Volume Data Reliability: Gaps in volume data or unusual market conditions (holidays, low-liquidity sessions) can skew ratio readings.
RISK DISCLAIMER
Trading any financial instrument involves substantial risk, and this indicator does not guarantee profits or prevent losses. All signals and visual cues are for educational and informational purposes only; past performance does not assure future outcomes. You retain full responsibility for your trading decisions, including proper risk management, position sizing, and the use of additional confirmation methods. Always consider the possibility of losing some or all of your original investment.

Previous Day High & Low)Previous Day High & Low (PDH/PDL)
This simple but essential tool plots the previous day's high and low as dynamic horizontal lines across the current trading session. Ideal for traders who rely on key support and resistance levels, this indicator automatically updates at the start of each new day and extends the levels across the chart.
🔹 Features:
Automatically tracks and draws the previous day’s high and low.
Lines update cleanly at each new session.
Helps identify breakout and reversal zones.
Perfect for scalpers, intraday traders, and anyone watching for reactions at key levels.
GStrategy 1000Pepe 15mTrend Following Candlestick Strategy with EMA Filter and Exit Delay
Strategy Concept
This strategy combines candlestick patterns with EMA trend filtering to identify high-probability trade entries, featuring:
Entry Signals: Hammer and Engulfing patterns confirmed by EMA trend
Trend Filter: Fast EMA (20) vs Slow EMA (50) crossover system
Risk Management: 5% stop-loss + 1% trailing stop
Smart Exit: 2-bar delay after exit signals to avoid whipsaws
Key Components
Trend Identification:
Uptrend: Fast EMA > Slow EMA AND rising
Downtrend: Fast EMA < Slow EMA AND falling
Entry Conditions:
pinescript
// Bullish Entry (Long)
longCondition = (Hammer OR Bullish Engulfing)
AND Uptrend
AND no existing position
// Bearish Entry (Short)
shortCondition = Bearish Engulfing
AND Downtrend
AND no existing position
Exit Mechanics:
Primary Exit: EMA crossover (Fast crosses Slow)
Delayed Execution: Waits 2 full candles after signal
Emergency Exits:
5% fixed stop-loss
1% trailing stop
Visual Dashboard:
Colored EMA lines (Blue=Fast, Red=Slow)
Annotated candlestick patterns
Background highlighting for signals
Distinct markers for entries/exits
Unique Features
Pattern Recognition:
Enhanced Hammer detection (strict body/wick ratios)
Multi-candle engulfing confirmation
Trend-Confirmation:
Requires price and EMA alignment
Filters counter-trend patterns
Exit Optimization:
pinescript
// Delay implementation
if exit_signal_triggered
counter := 2 // Start countdown
else if counter > 0
counter -= 1 // Decrement each bar
exit_trade = (counter == 1) // Execute on final bar
Risk Parameters
Parameter Value Description
Stop Loss 5% Fixed risk per trade
Trailing Stop 1% Locks in profits
Exit Delay 2 bars Reduces false exits
Position Size 100% No pyramiding
Visualization Examples
🟢 Green Triangle: Bullish entry
🔴 Red Triangle: Bearish entry
⬇️ Blue X: Long exit (after delay)
⬆️ Green X: Short exit (after delay)
🎯 Pattern Labels: Identifies hammer/engulfing
Recommended Use
Timeframes: 1H-4H (reduces noise)
Markets: Trend-prone assets (FX, indices)
Best Conditions: Strong trending markets
Avoid: Choppy/Ranging markets

Opening Range + Full-Day High/Low + Prev Day LevelsDraws a box around the first 15min range with horizontal lines extending throughout the day, with faded lines of the previous day's highs and lows, also draws arrows for 5m breakouts of those levels

DeltaStrike — Aggressive Candle Detector by Chaitu50cDeltaStrike — Aggressive Candle Detector
by Chaitu50c
DeltaStrike is a simple and effective tool designed to help traders identify the most aggressive candles on the chart in real time. It works purely on price action and internal candle dynamics, with no reliance on lagging indicators.
The indicator combines delta (directional strength), candle range, and volume to compute an overall aggressiveness score for each candle. When this score exceeds a dynamic threshold based on recent market behavior, the candle is marked as an aggressive move.
Aggressive bullish candles are plotted as green diamonds below the candle, while aggressive bearish candles are plotted as red diamonds above the candle. The goal is to help traders visually spot moments of strong directional pressure, where potential trends or reversals may emerge.
The detection logic adapts automatically to changing market volatility and volume, making it suitable for all instruments and timeframes, including index futures, equities, and forex.
An integrated dashboard on the chart displays live readings of the key components contributing to each candle’s aggressiveness score: delta ratio, range ratio, and volume ratio. This helps traders understand the internal structure of each aggressive move.
Features:
Dynamic aggressiveness detection based on delta, range, and volume
Adaptive threshold for consistent behavior across timeframes and instruments
Clean chart output with clear diamond markers only on selected candles
Live dashboard with internal metrics for advanced analysis
Simple, lightweight, and optimized for intraday and swing trading
Works with any instrument: index, equity, forex, commodity
DeltaStrike is intended as an objective visual aid to help traders focus on genuine moments of strong market intent, filtering out ordinary or passive price movement. It can be used standalone or in combination with your existing trading strategy.

Liquidity Engulfing (Nephew_Sam_)🔥 Liquidity Engulfing Multi-Timeframe Detector
This indicator finds engulfing bars which have swept liquidity from its previous candle. You can use it across 6 timeframes with fibonacci entries.
⚡ Key Features
6 Customizable Timeframes - Complete market structure analysis
Smart Liquidity Detection - Finds patterns that sweep liquidity then reverse
Real-Time Status Table - Confirmed vs unconfirmed patterns with color coding
Fibonacci Integration - 5 customizable fib levels for precise entries
HTF → LTF Strategy - Spot reversals on higher timeframes, enter on lower timeframe fibs
📈 Engulfing Rules
Bullish: Current candle bullish + previous bearish + current low < previous low + current close > previous open
Bearish: Current candle bearish + previous bullish + current high > previous high + current close < previous open

Candle Close Location MarkerThis script customizes the appearance of candlesticks by highlighting whether the candle closed in the upper, middle, or lower part of its range — using a small orange marker inside each candle.
It also includes a traditional volume histogram with two simple moving averages (SMA 20 and SMA 50), helping traders detect volume trends and potential reversals.
📌 Useful for identifying strength of momentum and visualizing market sentiment clearly.
Features:
• ✅ Colored candles: green for bullish, black for bearish
• ✅ Orange square shows the position of the close (top, middle, or bottom of the candle)
• ✅ Volume bars with SMA 20 (orange) and SMA 50 (blue)
• ✅ Works on all timeframes
Developed by:
Version: 1.0
Language: Pine Script v5
Smart Bar Counter with Alerts🚀 Smart Bar Counter with Alerts 🚀
-----------------------------------------------------
Overview
-----------------------------------------------------
Ever wanted to count a specific number of bars from a key point on your chart—such as after a Break of Structure (BOS), the start of a new trading session, or from any point of interest— without having to stare at the screen?
This "Smart Bar Counter" indicator was created to solve this exact problem. It's a simple yet powerful tool that allows you to define a custom "Start Point" and a "Target Bar Count." Once the target count is reached, it can trigger an Alert to notify you immediately.
-----------------------------------------------------
Key Features
-----------------------------------------------------
• Manual Start Point: Precisely select the date and time from which you want the count to begin, offering maximum flexibility in your analysis.
• Custom Bar Target: Define exactly how many bars you want to count, whether it's 50, 100, or 200 bars.
• On-Chart Display: A running count is displayed on each bar after the start time, allowing you to visually track the progress.
• Automatic Alerts: Set up alerts to be notified via TradingView's various channels (pop-up, mobile app, email) once the target count is reached.
-----------------------------------------------------
How to Use
-----------------------------------------------------
1. Add this indicator to your chart.
2. Go to the indicator's Settings (Gear Icon ⚙️).
- Select Start Time: Set the date and time you wish to begin counting.
- Number of Bars to Count: Input your target number.
3. Set up the Alert ( Very Important! ).
- Right-click on the chart > Select " Add alert ."
- In the " Condition " dropdown, select this indicator: Smart Bar Counter with Alerts .
- In the next dropdown, choose the available alert condition.
- Set " Options " to Once Per Bar Close .
- Choose your desired notification methods under " Alert Actions ."
- Click " Create ."
-----------------------------------------------------
Use Cases
-----------------------------------------------------
• Post-Event Analysis: Count bars after a key event like a Break of Structure (BOS) or Change of Character (CHoCH) to observe subsequent price action.
• Time-based Analysis: Use it to count bars after a market open for a specific session (e.g., London, New York).
• Strategy Backtesting: Useful for testing trading rules that are based on time or a specific number of bars.
-----------------------------------------------------
Final Words
-----------------------------------------------------
Hope you find this indicator useful for your analysis and trading strategies! Feel free to leave comments or suggestions below.

Candle Body Strength CounterThis indicator measures the total bullish and bearish candle body strength over a user-defined lookback period. For each bar, it sums the absolute body sizes of bullish candles (where close > open) and bearish candles (where close < open) within the lookback window. The result is two lines: one for bullish body strength and one for bearish body strength, making it easy to spot shifts in market momentum and bias.
Adjustable lookback period (default: 20 bars)
Green line: cumulative bullish body strength
Red line: cumulative bearish body strength
Use this tool to quickly assess which side (bulls or bears) has been stronger over your chosen timeframe.

Math by Thomas Liquidity PoolDescription
Math by Thomas Liquidity Pool is a TradingView indicator designed to visually identify potential liquidity pools on the chart by detecting areas where price forms clusters of equal highs or equal lows.
Bullish Liquidity Pools (Green Boxes): Marked below price where two adjacent candles have similar lows within a specified difference, indicating potential demand zones or stop loss clusters below support.
Bearish Liquidity Pools (Red Boxes): Marked above price where two adjacent candles have similar highs within the difference threshold, indicating potential supply zones or stop loss clusters above resistance.
This tool helps traders spot areas where smart money might hunt stop losses or where price is likely to react, providing valuable insight for trade entries, exits, and risk management.
Features:
Adjustable box height (vertical range) in points.
Adjustable maximum difference threshold between candle highs/lows to consider them equal.
Boxes automatically extend forward for visibility and delete when price sweeps through or after a defined lifetime.
Separate visual zones for bullish and bearish liquidity with customizable colors.
How to Use
Add the Indicator to your chart (preferably on instruments like Nifty where point-based thresholds are meaningful).
Adjust Inputs:
Box Height: Set the vertical size of the liquidity zones (default 15 points).
Max Difference Between Highs/Lows: Set the max price difference to consider two candle highs or lows as “equal” (default 10 points).
Box Lifetime: How many bars the box stays visible if not swept (default 120 bars).
Interpret Boxes:
Green Boxes (Bullish Liquidity Pools): Areas of potential demand and stop loss clusters below price. Watch for price bounces or accumulation near these zones.
Red Boxes (Bearish Liquidity Pools): Areas of potential supply and stop loss clusters above price. Watch for price rejections or distribution near these zones.
Trading Strategy Tips:
Use these zones to anticipate where stop loss hunting or liquidity sweeps may occur.
Combine with your Order Block, Fair Value Gap, and Market Structure tools for higher probability setups.
Manage risk by avoiding entries into price regions just before large liquidity pools get swept.
Automatic Cleanup:
Boxes delete automatically once price breaks above (for bearish zones) or below (for bullish zones) the zone or after the set lifetime.

Bounce Zone📘 Bounce Zone – Indicator Description
The "Bounce Zone" indicator is a custom tool designed to highlight potential reversal zones on the chart based on volume exhaustion and price structure. It identifies sequences of candles with low volume activity and marks key price levels that could act as "bounce zones", where price is likely to react.
🔍 How It Works
Volume Analysis:
The indicator calculates a Simple Moving Average (SMA) of volume (default: 20 periods).
It looks for at least 6 consecutive candles (configurable) where the volume is below this volume SMA.
Color Consistency:
The candles must all be of the same color:
Green candles (bullish) for potential downward bounce zones.
Red candles (bearish) for potential upward bounce zones.
Zone Detection:
When a valid sequence is found:
For green candles: it draws a horizontal line at the low of the last red candle before the sequence.
For red candles: it draws a horizontal line at the high of the last green candle before the sequence.
Bounce Tracking:
Each horizontal line remains on the chart until it is touched twice by price (high or low depending on direction).
After two touches, the line is automatically removed, indicating the zone has fulfilled its purpose.
📈 Use Cases
Identify areas of price exhaustion after strong directional pushes.
Spot liquidity zones where institutions might step in.
Combine with candlestick confirmation for reversal trades.
Useful in both trending and range-bound markets for entry or exit signals.
⚙️ Parameters
min_consecutive: Minimum number of consecutive low-volume candles of the same color (default: 6).
vol_ma_len: Length of the volume moving average (default: 20).
🧠 Notes
The indicator does not repaint and is based purely on historical candle and volume structure.
Designed for manual strategy confirmation or support for algorithmic setups.
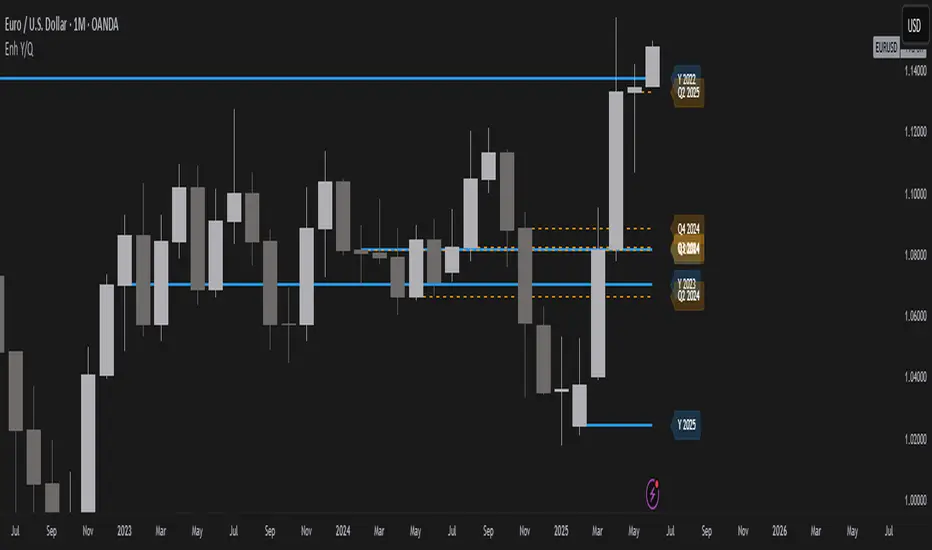
Year/Quarter Open LevelsDeveloped by ADEL CEZAR and inspired by insights from ERDAL Y, this indicator is designed to give traders a clear edge by automatically plotting the Yearly Open and Quarterly Open levels — two of the most critical institutional reference points in price action.
These levels often act as magnets for liquidity, bias confirmation zones, and support/resistance pivots on higher timeframes. With customizable settings, you can display multiple past opens, fine-tune label positions, and align your strategy with high-timeframe structure — all in a lightweight, non-intrusive design.
If you follow Smart Money Concepts (SMC), ICT models, or build confluence using HTF structures and range theory, this script will integrate seamlessly into your workflow.
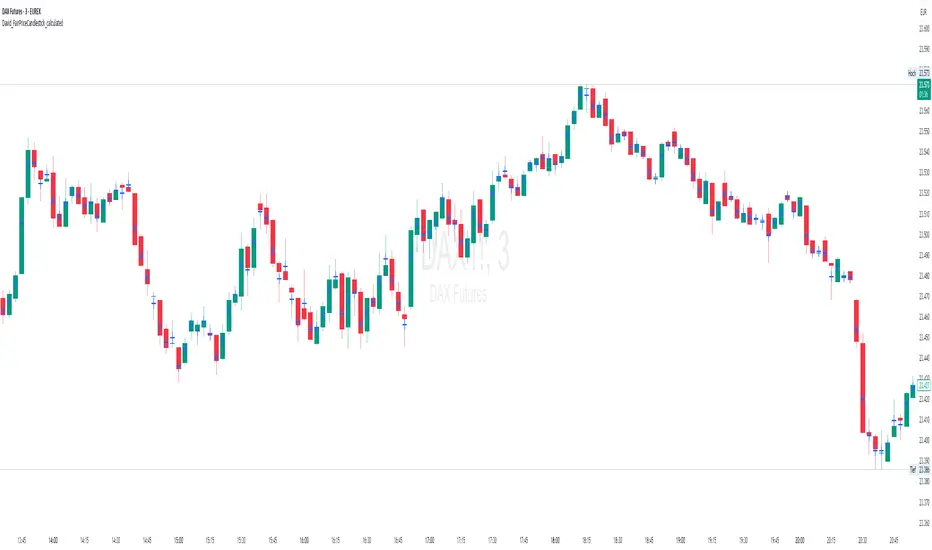
David_FairPriceCandlestick_calculatedDescription:
This indicator displays the "Typical Price" for each candle as a visual marker (cross) directly on the chart. The Typical Price is calculated as the average of the High, Low, and Close values of each bar:
(High + Low + Close) / 3
The marker provides a quick visual reference to the fair or average price level within every single candle.
Unlike a Point of Control (POC) or volume-based indicators, this script works purely with price data and is independent of volume or order flow.
Use cases:
Identify where most trading activity may have been concentrated within the candle (for price-based strategies)
Support as a reference line for mean-reversion or fair value concepts
Works on all timeframes and instruments
Customization:
You can easily change the marker style (cross, dot, triangle, etc.) and color within the script.
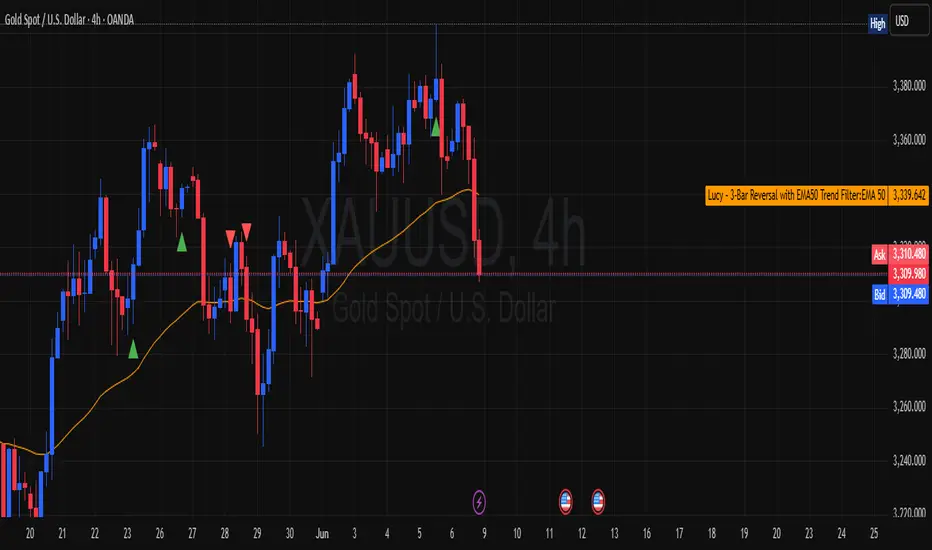
Lucy – 3-Bar Reversal with EMA50 Trend Filter📛 Lucy – 3-Bar Reversal with EMA50 Trend Filter
Purpose:
To detect and highlight bullish and bearish 3-bar reversal patterns on the chart, but only when they align with the dominant trend, defined by the EMA 50.
✅ How It Works
🟢 Bullish 3-Bar Reversal (Buy Setup):
Bar 1 is bearish (close < open)
Bar 2 makes a lower low than Bar 1
Bar 3 is bullish (close > open) and closes above Bar 2’s high
Price must be above EMA 50 (trend filter)
✅ Result: Shows a green triangle below the bar
🔴 Bearish 3-Bar Reversal (Sell Setup):
Bar 1 is bullish (close > open)
Bar 2 makes a higher high than Bar 1
Bar 3 is bearish (close < open) and closes below Bar 2’s low
Price must be below EMA 50
✅ Result: Shows a red triangle above the bar
📊 What It Plots:
🔼 Green triangle below bullish signal bar
🔽 Red triangle above bearish signal bar
🟠 Orange line = EMA50 (trend filter)
🔔 Built-in Alerts:
You’ll get an alert if:
A bullish reversal pattern forms above EMA50
A bearish reversal pattern forms below EMA50
🧠 Use Cases:
Great for trend-following traders who want clean, price-action entries
Works well on intraday (15m/1h) or swing (4h/daily) timeframes
Can be used for manual entries, or converted to strategy for automation
Forex Session Levels + Dashboard (AEST)This is a script showing all the key levels you will ever need for the breakout and retest strategy.
Follow my IG:
@liviupircalabu10

HTF 3rd Weekly High/LowThis indicator plots horizontal lines for the high and low of a selected past weekly candle, allowing traders to visualize higher time frame (HTF) structure on lower time frame charts (e.g., 1H, 4H, etc.).
Features:
Custom Weekly Range Selection: Use the dropdown to choose which weekly candle to reference — from the current week (0) to up to five weeks back.
Clean Horizontal Lines: High and low levels of the selected week are drawn as persistent horizontal lines.
Automatic Text Labels: Labels like Week-3H and Week-3L are shown on the right side of the chart, matching the week selected.
Customization:
Line colors
Line width and style (solid, dotted, dashed)
Text label offset
Automatic Refresh: Levels and labels are redrawn at the start of each new week to stay current with your selection.

Trend Persistence Counter (TPC) by riskcipher🧭 Trend Persistence Counter (TPC) – A Simple Price Action Trend Duration Tool
Trend Persistence Counter (TPC) is a lightweight indicator that counts how long a trend persists after a breakout.
It is entirely based on price action, without using any moving averages or smoothing. The goal is to give a simple, rule-based view of trend continuity.
🧠 How It Works (Logic Overview)
This indicator switches between two modes: bullish and bearish.
If close > previous high, the counter enters bullish mode, and starts at +1
While in bullish mode:
If close >= previous low → continue the uptrend → +1 each bar
If close < previous low → trend ends → reset to 0, switch to bearish mode
If close < previous low, the counter enters bearish mode, and starts at -1
While in bearish mode:
If close <= previous high → continue the downtrend → -1 each bar
If close > previous high → trend ends → reset to 0, switch to bullish mode
This provides a bar-by-bar count of trend persistence based on whether price holds structure.
🎯 Use Cases
Track how long a trend continues after a breakout
Quickly detect when trend structure breaks
Help visually filter “strong” vs “weak” moves
Build logic-based alerts (e.g., trend continues for N bars)
🔍 Why Use This Instead of Traditional Indicators?
This is not meant to replace moving averages or trend filters.
But it offers some advantages for those who prefer structure-based logic:
Feature TPC
Based on Price Action ✅ Yes
Uses Lagging Filters ❌ No moving average or smoothing
Trend Duration Measurement ✅ Counts valid consecutive moves
Complexity ⚪ Very simple and transparent
It’s a simple concept and easy to understand, but still useful when combined with other tools or visualized on its own.
⚙️ Technical Notes
Works on any timeframe or instrument
The value is positive during bullish persistence, negative during bearish
Value resets to 0 when trend structure breaks
All logic is calculated bar-by-bar, in real time
✅ Example Usage Ideas
Highlight candles when TPC value crosses a certain threshold (e.g., strong breakout continuation)
Use the zero-cross as a potential reversal warning
Filter trend signals in your existing strategies

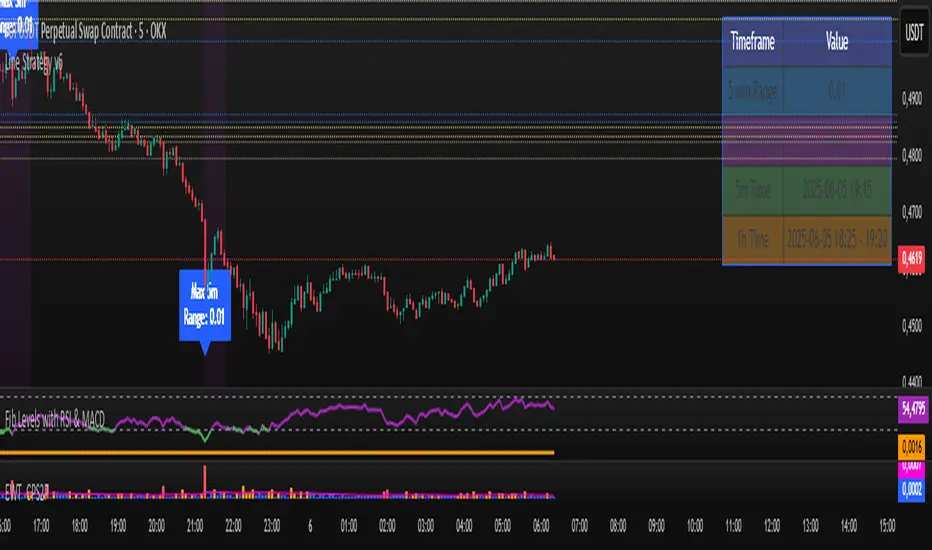
Line Strategy v6Line Indicator for TradingView
This Pine Script indicator identifies the largest candles on both 5-minute and 1-hour timeframes within the last 240 five-minute bars. It provides visual markers and detailed information to help traders spot significant price movements.
Key Features
Dual Timeframe Analysis:
Identifies largest candle on 5-minute timeframe
Identifies largest candle on 1-hour timeframe (aggregated from 12 five-minute candles)
Visual Markers:
Blue label marks the highest-range 5-minute candle
Purple background highlights the highest-range hourly candle period
Information Table:
Shows price ranges for both timeframes
Displays precise timestamps for identified candles
Color-coded for quick reference
Progress Indicator:
Shows how many bars have been collected (out of 240 required)
How It Works
Data Collection:
Stores high, low, timestamp, and bar index of the last 240 five-minute candles
Automatically updates with each new bar
5-Minute Analysis:
Scans all 5-minute candles to find the one with the largest price range (high - low)
Marks this candle with a blue label showing its range
Hourly Analysis:
Groups 12 five-minute candles to form each hourly candle
Finds the hourly candle with the largest price range
Highlights the entire hour period with a purple background
Information Display:
Creates a table in the top-right corner showing:
Range values for both timeframes
Timestamps of identified candles
Time period of the largest hourly candle
Usage Instructions
Apply the indicator to any 5-minute chart
Wait for the indicator to collect 240 bars (about 20 trading hours)
Results will appear automatically:
Blue label on the largest 5-minute candle
Purple background on the largest hourly candle period
Information table with detailed metrics
Customization Options
You can easily adjust these aspects by modifying the code:
Colors of markers and table cells
Transparency levels of background highlights
Precision of range values displayed
Position of the information table
The indicator is optimized for performance and works in both historical and real-time modes.